What CHIEF measures
Start with the question, not the number
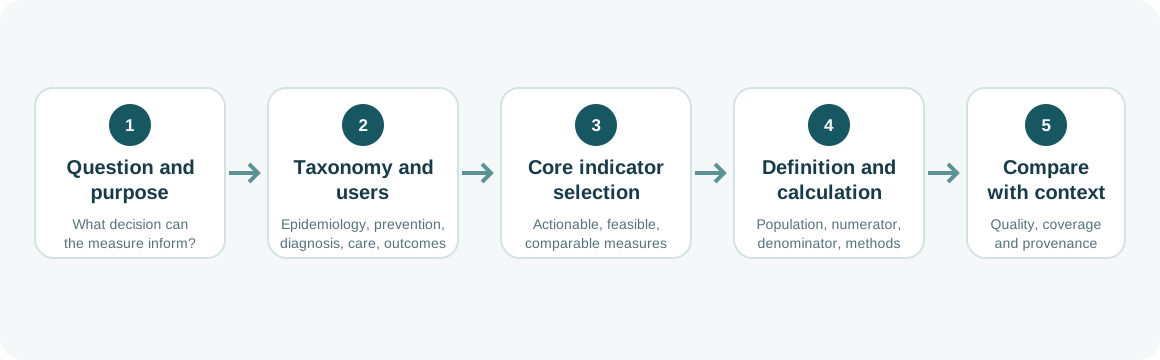
CHIEF treats an indicator as a defined measure with a purpose: it should help a person, service, registry or policymaker understand a health condition and decide what to examine next. The work therefore began by organising the indicator landscape before selecting a diabetes set that could be tested with real data.
The taxonomy groups measures across epidemiology, prevention, diagnosis, treatment and outcomes. It also makes visible the people and organisations who may use them: citizens and people living with a condition, health professionals, service managers, funders, national policy teams and European institutions. Different users may need different levels of detail, but the underlying definition must remain explicit if results are to be compared.
Indicator selection considered whether a measure could reflect disease burden, be calculated from available sources and support monitoring, benchmarking, audit or feedback. The report distinguishes incidence from prevalence: incidence can inform screening and new events, while prevalence often better describes the population currently receiving care. The interpretation depends on the question and the way the measure is defined.
A layered indicator set
Macro, meso and micro views
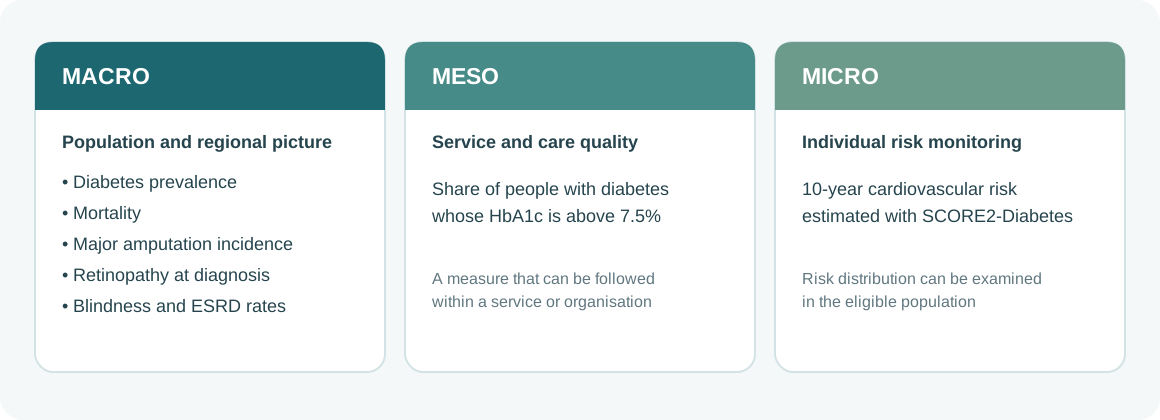
The report organises indicators at three complementary levels. Macro measures describe population patterns and support regional or national comparison. Meso measures track aspects of service quality. Micro measures can identify risk patterns for more focused clinical or public-health attention. These levels are connected: population outcomes set the wider picture, service measures show where care can be examined, and risk models help describe variation among individuals.
- Macro: diabetes prevalence and mortality; incidence of major lower-extremity amputation; retinopathy newly recorded at diagnosis; blindness; and end-stage renal disease.
- Meso: the percentage of people with diabetes whose HbA1c is above 7.5%.
- Micro: ten-year cardiovascular risk estimated with SCORE2-Diabetes, including the proportion above the report’s 0.1 risk threshold.
Making a measure reproducible
Define what enters the calculation
Each indicator needs a specification that makes its calculation inspectable. The CHIEF work describes the purpose, target population, numerator, denominator, exclusions, timing, disease classification and statistical method. Where appropriate, specifications also identify stratification and standardisation choices, event ascertainment and the common data elements required from contributing sources.
These details matter because seemingly small differences can change the result. Age limits, whether an event is counted once or repeatedly, the date used as time origin, and whether an estimate is crude or standardised all affect interpretation. For longitudinal outcomes, competing events and incomplete follow-up may require methods that differ from a simple proportion. A shared definition helps teams identify where a measure can be produced directly, where linkage or additional data are needed, and where the available sources do not support it.
The specifications were designed around diabetes as a practical test case while remaining relevant to other NCD domains. Coding was mapped across systems used in clinical and administrative settings so that a definition can travel between sources without assuming that every data holder stores information in the same way.
Scientific papers and associated outputs
Indicator definition and quality
- Carinci F, Poljičanin T, Cunningham S, Fava S, Štotl I, Lepiksone J, Nicholson N, Massi Benedetti M, Klazinga N. A taxonomy of indicators for non-communicable diseases: agreement, definition, and contextual description using diabetes as a case study. Frontiers in Public Health. 2025;13. Full text.
- Nicholson N, Carvalho R, Štotl I. A FAIR perspective on data quality frameworks. Data. 2025;10(9):136. Article.
References
Selected references
- Pennells L, Kaptoge S, Read SH, et al. SCORE2-Diabetes: 10-year cardiovascular risk estimation in type 2 diabetes in Europe. European Heart Journal. 2023;44(28):2544–2556. Article.
- Carinci F, Van Gool K, Mainz J, et al. Towards actionable international comparisons of health system performance. International Journal for Quality in Health Care. 2015;27(2):137–146. doi:10.1093/intqhc/mzv004.