A distributed way to produce evidence
Common methods, local data
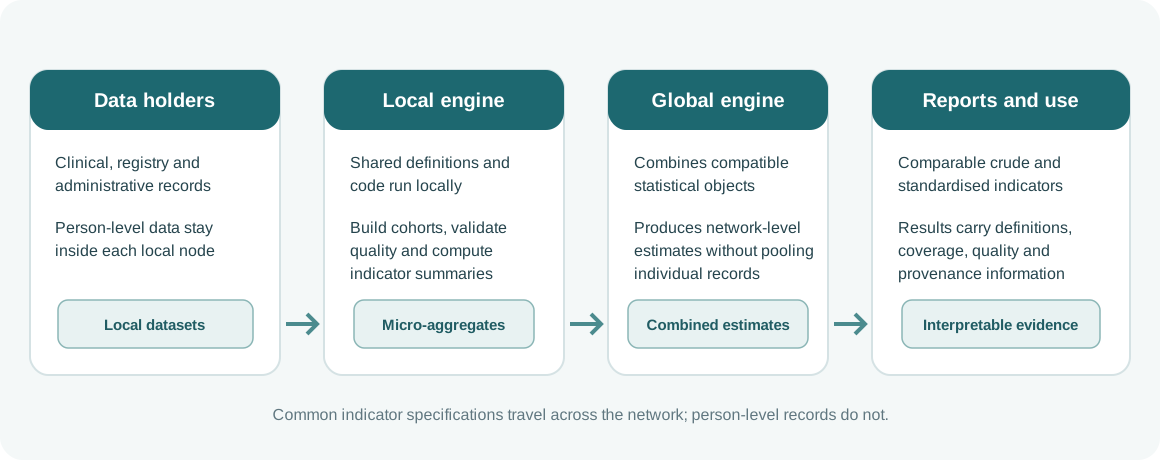
Federated analytics (FA) allows a network to answer shared questions without first pooling all person-level records in one central database. Data holders apply agreed definitions and analytical routines to their own data; the network combines the resulting statistical summaries to produce a broader view.
Within CHIEF, this approach was considered for the recurring production of NCD indicators and for more demanding longitudinal analyses. The aim was not to treat privacy and analysis as competing goals, but to organise computation so that data can be analysed where they are held and only appropriate aggregate information moves between network levels.
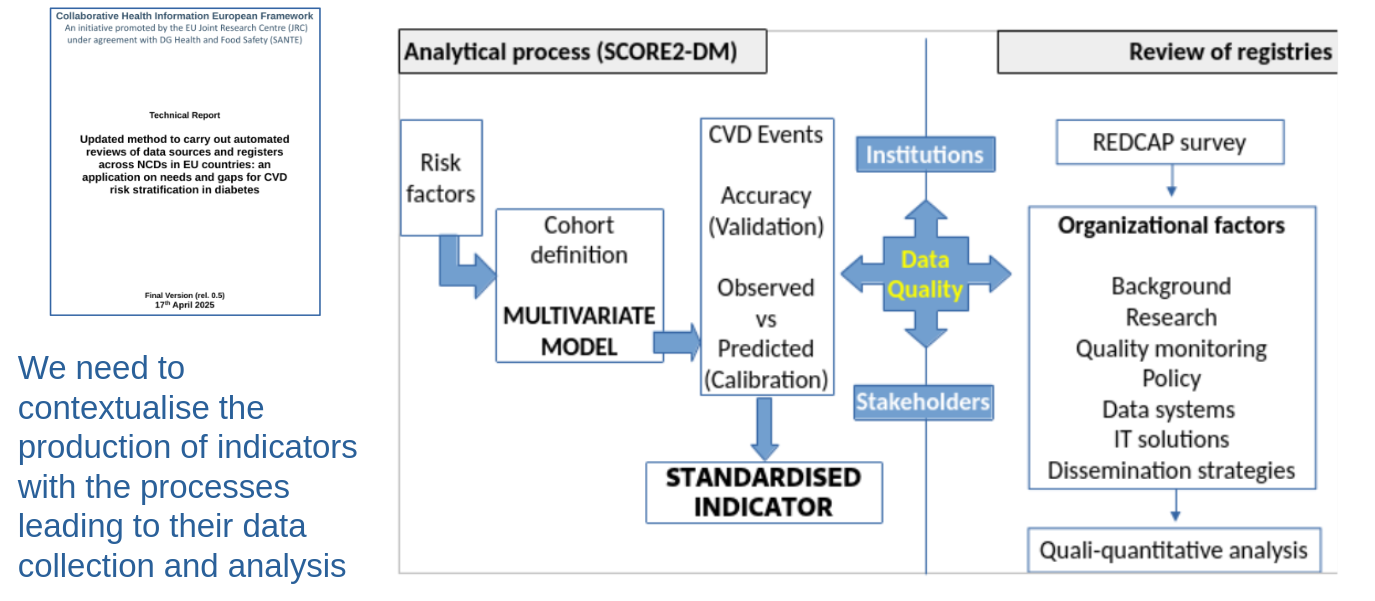
The work combined a review of federated methods with testing of data quality and risk prediction. SCORE2-Diabetes was used as a case study because cardiovascular risk estimation depends on several clinical variables, accurate follow-up and reliable ascertainment of outcomes. Differences in completeness can affect both the risk model and any indicator derived from it.
Testing the methods
From model quality to real-world indicators
An initial test used anonymous data from the Maltese Diabetes Registry, including linked clinic, hospital and laboratory records. It examined the information needed for cardiovascular risk prediction, the accuracy of relevant endpoints, competing risks and the completeness of risk factors. The report notes that modelling depends on whether outcomes such as non-fatal cardiovascular events, amputation or end-stage kidney disease are reliably recorded, and whether other events that alter the risk of the target outcome can be taken into account.
The next field test used the REWINDER cohort in Emilia-Romagna, with information on more than 70,000 people with diabetes followed for six years. It applied the CHIEF specifications to prevalence, mortality, retinopathy at diagnosis and amputation; it also assessed HbA1c using last and mean values, and cardiovascular risk using SCORE2-Diabetes. Amputation and cardiovascular risk required time-to-event approaches that accounted for competing risks.
The test showed why an indicator must specify its population, time origin, numerator, denominator, exclusions, event definition and supporting data sources. Some measures could be calculated directly; others depended on linkage or a defined clinically observed sub-cohort; some were not supported by the available sources. This is a practical distinction for interpreting a distributed result.
The analytical pathway
Local computation and shared reporting
The CHIEF proof of concept joined cohort construction, common data elements, indicator calculation, contextualisation and visual reporting in one process. The R reference software translates the shared definitions into local routines and configuration files that can run in NeuBIRO. At each node, the local engine produces statistical objects; the global engine combines compatible summaries and prepares network-level estimates.
Person-level records remain at the data holder. The combined outputs can include crude and standardised estimates, quality and completeness information, the population and time interval covered, and the analytical definition used. The reporting layer provides a way to inspect and filter results, with reproducible outputs described in the report. A comparison between centralised and federated calculations on the same data was used to check that the distributed process returned equivalent results in the test setting.
The result is a reusable analytical pattern: common specifications travel across the network, computation is performed close to the source, and results are accompanied by the context needed for review. The REWINDER example demonstrates how this pattern can be applied; its figures describe that cohort and should not be read as European population estimates.
Scientific papers and associated outputs
Federated methods and applications
- Carinci F, Fava S, Štotl I, Nicholson N. Federated analytics for non-communicable disease surveillance in the European Health Data Space: a scoping review and conceptual framework. Frontiers in Public Health. 2026;14:1911992. Full text.
- Carinci F, Nicholson N. Linking registries to deliver standardised NCD indicators in the European Health Data Space: why do we need a Collaborative Health Information European Framework? Frontiers in Public Health. 2025. Full text.
- Carinci F, Messina R, Mencarelli M, et al. Implementing a federated regional diabetes register in a decentralized health system: implications for healthcare organization and the European Health Data Space. Frontiers in Public Health. 2026;14:1864673. Article.
References
Selected references
- Carinci F, Messina R, Michelini M, et al. Real-world data and patient-reported outcomes in diabetes in Emilia-Romagna (REWINDER): protocol of a federated cohort study. BMJ Open. 2025;15:e102401. doi:10.1136/bmjopen-2025-102401.