From a value to an interpretable result
Numbers need their context
A percentage or rate does not explain where the data came from, which population it represents, how it was calculated or how much of the eligible population could be analysed. CHIEF treats contextualisation as part of the indicator itself: the result and the information needed to interpret it should travel together.
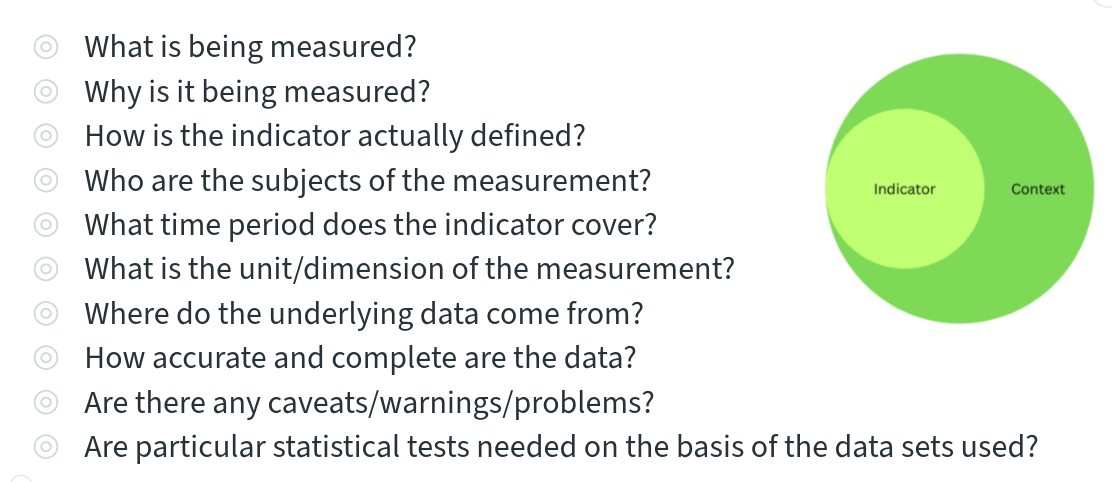
The contextual information framework was designed to support transparent comparison across heterogeneous sources. It links an indicator’s name and purpose to its definition, calculation method, common data elements, source data, time period, coverage, quality and known limitations. This makes the calculation easier to reproduce and gives analysts, clinicians and policy users a basis for deciding whether two results are meaningfully comparable.
The framework builds on SOLICIT, a domain-neutral approach to semantic contextualisation. CHIEF extends this structure for NCD indicators so that shared concepts can be reused across disease areas, while disease-specific terms and measures remain clearly described. In this model, metadata is not an administrative appendix: it is the explanatory layer around the reported value.
A common semantic structure
Describe both the indicator and its sources
The report’s model has two connected parts. First, it describes the indicator: what is measured, why it matters, which population is included, how numerator and denominator are derived, and which statistical procedure is applied. Second, it describes the source data and the conditions under which they were collected, including their type, coverage and quality. The semantic links between these elements preserve the chain from source to estimate.
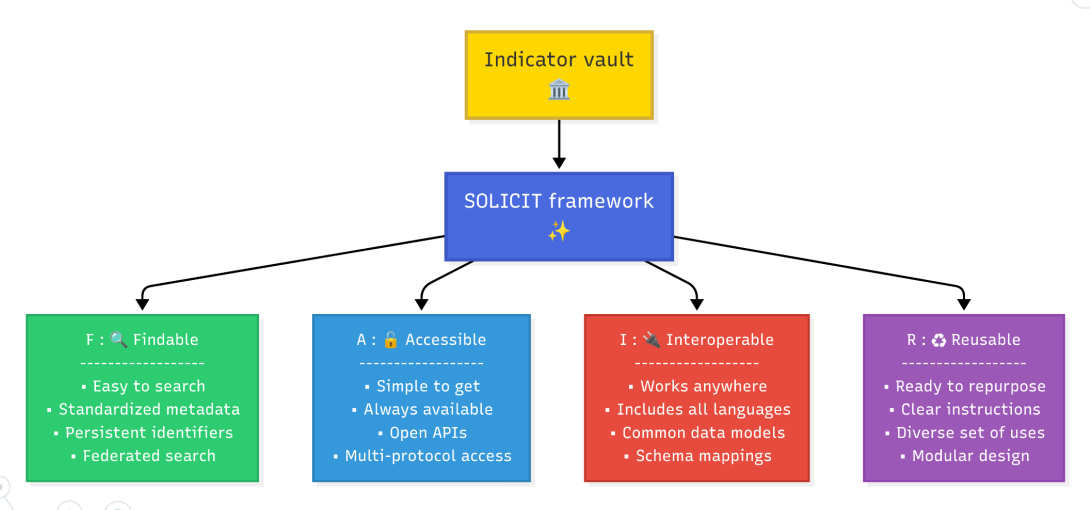
This structure can be represented in a FAIR-oriented indicator vault. A common knowledge base can make indicator definitions easier to find and reuse; expose the metadata through accessible interfaces; link related concepts and code systems; and support reuse across data holders and NCD domains. The proposed approach is intended to connect to other metadata models rather than create an isolated vocabulary.
For machine-supported use, this explicit structure is important: a system can only compare or reuse values appropriately if it can inspect how those values were generated and what each element means. The same metadata can also support human review by making assumptions and provenance visible.
Quality and completeness
Explain what is missing and why
CHIEF uses completeness to connect eligibility with the population that can actually be analysed. A completeness value is therefore more than a count of missing fields: it can show which part of the eligible population contributes to an estimate and how this varies between data holders or over time.
That distinction changes interpretation. A centre reporting a high proportion of people with elevated blood pressure may differ from another because of clinical patterns, but also because of measurement protocols, age and comorbidity profiles, organisation or missing data. If these conditions are not recorded, a comparison can confuse differences in data capture with differences in health. Contextual metadata helps separate those explanations and makes quality limitations visible alongside the result.
In the CHIEF field work, indicator definitions, data quality dimensions and contextual records were considered together. The aim was to support comparable reporting without requiring every source to be identical, and to give data holders a clearer basis for reviewing the quality of their own information.
Scientific papers and associated outputs
Semantic and FAIR contextualisation
- Štotl I, Carinci F, Fava S, et al. FAIR foundations of a novel indicator vault for non-communicable diseases in the European Union: feasibility study for effective contextualisation of indicators. Frontiers in Digital Health. 2025. Full text.
- Nicholson N, Štotl I. A generic framework for the semantic contextualisation of indicators. Frontiers in Computer Science. 2024;6. Article.
References
Selected references
- Nicholson N, Negrao Carvalho R, Štotl I. A FAIR perspective on data quality frameworks. Data. 2025;10(9):136. doi:10.3390/data10090136.
- Carinci F, Poljičanin T, Cunningham S, et al. A taxonomy of indicators for non-communicable diseases. Frontiers in Public Health. 2025;13. doi:10.3389/fpubh.2025.1685731.