| HbA1c |
Valid Value (%) |
NV/NA (%) |
|
| Valid Value |
1485 ( 80.8) |
0 ( 0.0) |
1485 ( 80.8) |
| NV/NA |
354 ( 19.2) |
0 ( 0.0) |
354 ( 19.2) |
|
1839 (100.0) |
0 ( 0.0) |
1839 (100.0) |
Table 6.4.1.1 : HbA1c (by Type of Diabetes)
| CMH Chi-Square |
p.value |
df |
| 695.5742 |
0 |
1 |

|
Barplot 6.4.1.1 - HbA1c (by Type of Diabetes)
| HbA1c |
Type 1 (%) |
Type 2 (%) |
Other Type (%) |
|
| <7 |
294 ( 20.4) |
15 ( 62.5) |
14 ( 66.7) |
323 ( 21.8) |
| [7 - 7.5) |
182 ( 12.6) |
3 ( 12.5) |
2 ( 9.5) |
187 ( 12.6) |
| [7.5 - 8.5) |
382 ( 26.5) |
2 ( 8.3) |
4 ( 19.0) |
388 ( 26.1) |
| >=8.5 |
581 ( 40.4) |
4 ( 16.7) |
1 ( 4.8) |
586 ( 39.5) |
|
1439 ( 97.0) |
24 ( 1.6) |
21 ( 1.4) |
1484 (100.0) |
Table 6.4.1.2 : HbA1c (by Type of Diabetes)
| CMH Chi-Square |
p.value |
df |
| 52.3575 |
0 |
6 |

|
Barplot 6.4.1.2 - HbA1c (by Type of Diabetes)

|
Barplot 6.4.1.2a - HbA1c (by Data Source, Type of Diabetes = Type 1)

|
Barplot 6.4.1.2b - HbA1c (by Data Source, Type of Diabetes = Type 2)

|
Barplot 6.4.1.2c - HbA1c (by Data Source, Type of Diabetes = Other Type)
| HbA1c |
Valid Value (%) |
NV/NA (%) |
|
| Valid Value |
1485 ( 80.8) |
0 ( 0.0) |
1485 ( 80.8) |
| NV/NA |
354 ( 19.2) |
0 ( 0.0) |
354 ( 19.2) |
|
1839 (100.0) |
0 ( 0.0) |
1839 (100.0) |
Table 6.4.1.3 : HbA1c (by Gender)
| CMH Chi-Square |
p.value |
df |
| 695.5742 |
0 |
1 |

|
Barplot 6.4.1.3 - HbA1c (by Gender)
| HbA1c |
Male (%) |
Female (%) |
|
| <7 |
183 ( 23.9) |
140 ( 19.5) |
323 ( 21.8) |
| [7 - 7.5) |
94 ( 12.3) |
93 ( 13.0) |
187 ( 12.6) |
| [7.5 - 8.5) |
196 ( 25.6) |
192 ( 26.7) |
388 ( 26.1) |
| >=8.5 |
293 ( 38.3) |
293 ( 40.8) |
586 ( 39.5) |
|
766 ( 51.6) |
718 ( 48.4) |
1484 (100.0) |
Table 6.4.1.4 : HbA1c (by Gender)
| CMH Chi-Square |
p.value |
df |
| 4.2229 |
0.2384 |
3 |

|
Barplot 6.4.1.4 - HbA1c (by Gender)

|
Barplot 6.4.1.4a - HbA1c (by Data Source, Gender = Male)

|
Barplot 6.4.1.4b - HbA1c (by Data Source, Gender = Female)
| HbA1c |
Valid Value (%) |
NV/NA (%) |
|
| Valid Value |
1485 ( 80.8) |
0 ( 0.0) |
1485 ( 80.8) |
| NV/NA |
354 ( 19.2) |
0 ( 0.0) |
354 ( 19.2) |
|
1839 (100.0) |
0 ( 0.0) |
1839 (100.0) |
Table 6.4.1.5 : HbA1c (by Age)
| CMH Chi-Square |
p.value |
df |
| 695.5742 |
0 |
1 |

|
Barplot 6.4.1.5 - HbA1c (by Age)
| HbA1c |
<5 (%) |
[5 - 10) (%) |
[10 - 15) (%) |
[15 - 18) (%) |
|
| <7 |
14 ( 19.2) |
67 ( 22.3) |
159 ( 26.3) |
83 ( 16.4) |
323 ( 21.8) |
| [7 - 7.5) |
9 ( 12.3) |
47 ( 15.6) |
80 ( 13.2) |
51 ( 10.1) |
187 ( 12.6) |
| [7.5 - 8.5) |
14 ( 19.2) |
88 ( 29.2) |
145 ( 24.0) |
141 ( 27.9) |
388 ( 26.1) |
| >=8.5 |
36 ( 49.3) |
99 ( 32.9) |
220 ( 36.4) |
231 ( 45.7) |
586 ( 39.5) |
|
73 ( 4.9) |
301 ( 20.3) |
604 ( 40.7) |
506 ( 34.1) |
1484 (100.0) |
Table 6.4.1.6 : HbA1c (by Age)
| CMH Chi-Square |
p.value |
df |
| 33.1301 |
1e-04 |
9 |

|
Barplot 6.4.1.6 - HbA1c (by Age)

|
Barplot 6.4.1.6a - HbA1c (by Data Source, Age = <5)

|
Barplot 6.4.1.6b - HbA1c (by Data Source, Age = [5 - 10))

|
Barplot 6.4.1.6c - HbA1c (by Data Source, Age = [10 - 15))

|
Barplot 6.4.1.6d - HbA1c (by Data Source, Age = [15 - 18))
| HbA1c |
Gender |
|
| Valid Value (%) |
NV/NA (%) |
|
| Valid Value |
1439 ( 81.3) |
0 ( 0.0) |
1439 ( 81.3) |
| NV/NA |
332 ( 18.7) |
0 ( 0.0) |
332 ( 18.7) |
|
1771 (100.0) |
0 ( 0.0) |
1771 (100.0) |
Table 6.4.1.7 : HbA1c (by Gender, Type of Diabetes = Type 1)
| CMH Chi-Square |
p.value |
df |
| 691.9531 |
0 |
1 |

|
Barplot 6.4.1.7 - HbA1c (by Gender, Type of Diabetes = Type 1)
| HbA1c |
Gender |
|
| Male (%) |
Female (%) |
|
| <7 |
166 ( 22.3) |
128 ( 18.4) |
294 ( 20.4) |
| [7 - 7.5) |
91 ( 12.2) |
91 ( 13.1) |
182 ( 12.6) |
| [7.5 - 8.5) |
194 ( 26.1) |
188 ( 27.0) |
382 ( 26.5) |
| >=8.5 |
292 ( 39.3) |
289 ( 41.5) |
581 ( 40.4) |
|
743 ( 51.6) |
696 ( 48.4) |
1439 (100.0) |
Table 6.4.1.8 : HbA1c (by Gender, Type of Diabetes = Type 1)
| CMH Chi-Square |
p.value |
df |
| 3.4899 |
0.3221 |
3 |

|
Barplot 6.4.1.8 - HbA1c (by Gender, Type of Diabetes = Type 1)

|
Barplot 6.4.1.8a - HbA1c (by Data Source, Gender = Male, Type of Diabetes=Type 1)

|
Barplot 6.4.1.8b - HbA1c (by Data Source, Gender = Female, Type of Diabetes=Type 1)
| HbA1c |
Age |
|
| Valid Value (%) |
NV/NA (%) |
|
| Valid Value |
1439 ( 81.3) |
0 ( 0.0) |
1439 ( 81.3) |
| NV/NA |
332 ( 18.7) |
0 ( 0.0) |
332 ( 18.7) |
|
1771 (100.0) |
0 ( 0.0) |
1771 (100.0) |
Table 6.4.1.9 : HbA1c (by Age, Type of Diabetes = Type 1)
| CMH Chi-Square |
p.value |
df |
| 691.9531 |
0 |
1 |

|
Barplot 6.4.1.9 - HbA1c (by Gender, Type of Diabetes = Type 1)
| HbA1c |
Age |
|
| <5 (%) |
[5 - 10) (%) |
[10 - 15) (%) |
[15 - 18) (%) |
|
| <7 |
10 ( 14.7) |
62 ( 20.9) |
148 ( 25.2) |
74 ( 15.2) |
294 ( 20.4) |
| [7 - 7.5) |
9 ( 13.2) |
47 ( 15.9) |
79 ( 13.4) |
47 ( 9.7) |
182 ( 12.6) |
| [7.5 - 8.5) |
13 ( 19.1) |
88 ( 29.7) |
143 ( 24.3) |
138 ( 28.3) |
382 ( 26.5) |
| >=8.5 |
36 ( 52.9) |
99 ( 33.4) |
218 ( 37.1) |
228 ( 46.8) |
581 ( 40.4) |
|
68 ( 4.7) |
296 ( 20.6) |
588 ( 40.9) |
487 ( 33.8) |
1439 (100.0) |
Table 6.4.1.10 : HbA1c (by Age, Type of Diabetes = Type 1)
| CMH Chi-Square |
p.value |
df |
| 37.3367 |
0 |
9 |

|
Barplot 6.4.1.10 - HbA1c (by Age, Type of Diabetes = Type 1)

|
Barplot 6.4.1.10a - HbA1c (by Data Source, Age = <5, Type of Diabetes=Type 1)

|
Barplot 6.4.1.10b - HbA1c (by Data Source, Age = [5 - 10), Type of Diabetes=Type 1)

|
Barplot 6.4.1.10c - HbA1c (by Data Source, Age = [10 - 15), Type of Diabetes=Type 1)

|
Barplot 6.4.1.10d - HbA1c (by Data Source, Age = [15 - 18), Type of Diabetes=Type 1)
| HbA1c |
Gender * Age |
|
| Valid Value |
NV/NA |
|
Valid Value (%) |
NV/NA (%) |
Valid Value (%) |
NV/NA (%) |
|
| Valid Value |
1439 ( 81.3) |
0 ( 0.0) |
0 ( 0.0) |
0 ( 0.0) |
1439 ( 81.3) |
| NV/NA |
332 ( 18.7) |
0 ( 0.0) |
0 ( 0.0) |
0 ( 0.0) |
332 ( 18.7) |
|
1771 (100.0) |
0 ( 0.0) |
0 ( 0.0) |
0 ( 0.0) |
1771 (100.0) |
Table 6.4.1.11 : HbA1c (by Gender * Age, Type of Diabetes = Type 1)
| HbA1c |
Gender * Age |
|
| <5 |
[5 - 10) |
[10 - 15) |
[15 - 18) |
|
Male (%) |
Female (%) |
Male (%) |
Female (%) |
Male (%) |
Female (%) |
Male (%) |
Female (%) |
|
| <7 |
63 ( 20.9) |
85 ( 29.7) |
32 ( 14.1) |
42 ( 16.2) |
3 ( 10.0) |
7 ( 18.4) |
30 ( 21.9) |
32 ( 20.1) |
294 ( 20.4) |
| [7 - 7.5) |
44 ( 14.6) |
35 ( 12.2) |
21 ( 9.3) |
26 ( 10.0) |
5 ( 16.7) |
4 ( 10.5) |
21 ( 15.3) |
26 ( 16.4) |
182 ( 12.6) |
| [7.5 - 8.5) |
76 ( 25.2) |
67 ( 23.4) |
67 ( 29.5) |
71 ( 27.3) |
4 ( 13.3) |
9 ( 23.7) |
41 ( 29.9) |
47 ( 29.6) |
382 ( 26.5) |
| >=8.5 |
119 ( 39.4) |
99 ( 34.6) |
107 ( 47.1) |
121 ( 46.5) |
18 ( 60.0) |
18 ( 47.4) |
45 ( 32.8) |
54 ( 34.0) |
581 ( 40.4) |
|
302 ( 21.0) |
286 ( 19.9) |
227 ( 15.8) |
260 ( 18.1) |
30 ( 2.1) |
38 ( 2.6) |
137 ( 9.5) |
159 ( 11.0) |
1439 (100.0) |
Table 6.4.1.12 : HbA1c (by Gender * Age, Type of Diabetes = Type 1)
| CMH Chi-Square |
p.value |
df |
| 803.0681 |
0 |
31 |
| HbA1c |
Gender |
|
| Valid Value (%) |
NV/NA (%) |
|
| Valid Value |
25 ( 78.1) |
0 ( 0.0) |
25 ( 78.1) |
| NV/NA |
7 ( 21.9) |
0 ( 0.0) |
7 ( 21.9) |
|
32 (100.0) |
0 ( 0.0) |
32 (100.0) |
Table 6.4.1.13 : HbA1c (by Gender, Type of Diabetes = Type 2)
| CMH Chi-Square |
p.value |
df |
| 10.125 |
0.0015 |
1 |

|
Barplot 6.4.1.11 - HbA1c (by Gender, Type of Diabetes = Type 2)
| HbA1c |
Gender |
|
| Male (%) |
Female (%) |
|
| <7 |
9 ( 81.8) |
6 ( 46.2) |
15 ( 62.5) |
| [7 - 7.5) |
2 ( 18.2) |
1 ( 7.7) |
3 ( 12.5) |
| [7.5 - 8.5) |
0 ( 0.0) |
2 ( 15.4) |
2 ( 8.3) |
| >=8.5 |
0 ( 0.0) |
4 ( 30.8) |
4 ( 16.7) |
|
11 ( 45.8) |
13 ( 54.2) |
24 (100.0) |
Table 6.4.1.14 : HbA1c (by Gender, Type of Diabetes = Type 2)
| CMH Chi-Square |
p.value |
df |
| 6.814 |
0.0781 |
3 |

|
Barplot 6.4.1.12 - HbA1c (by Gender, Type of Diabetes = Type 2)

|
Barplot 6.4.1.12a - HbA1c (by Data Source, Gender = Male, Type of Diabetes=Type 2)

|
Barplot 6.4.1.12b - HbA1c (by Data Source, Gender = Female, Type of Diabetes=Type 2)
| HbA1c |
Age |
|
| Valid Value (%) |
NV/NA (%) |
|
| Valid Value |
25 ( 78.1) |
0 ( 0.0) |
25 ( 78.1) |
| NV/NA |
7 ( 21.9) |
0 ( 0.0) |
7 ( 21.9) |
|
32 (100.0) |
0 ( 0.0) |
32 (100.0) |
Table 6.4.1.15 : HbA1c (by Age, Type of Diabetes = Type 2)
| CMH Chi-Square |
p.value |
df |
| 10.125 |
0.0015 |
1 |

|
Barplot 6.4.1.13 - HbA1c (by Gender, Type of Diabetes = Type 2)
| HbA1c |
Age |
|
| <5 (%) |
[5 - 10) (%) |
[10 - 15) (%) |
[15 - 18) (%) |
|
| <7 |
3 (100.0) |
1 (100.0) |
4 ( 57.1) |
7 ( 53.8) |
15 ( 62.5) |
| [7 - 7.5) |
0 ( 0.0) |
0 ( 0.0) |
1 ( 14.3) |
2 ( 15.4) |
3 ( 12.5) |
| [7.5 - 8.5) |
0 ( 0.0) |
0 ( 0.0) |
0 ( 0.0) |
2 ( 15.4) |
2 ( 8.3) |
| >=8.5 |
0 ( 0.0) |
0 ( 0.0) |
2 ( 28.6) |
2 ( 15.4) |
4 ( 16.7) |
|
3 ( 12.5) |
1 ( 4.2) |
7 ( 29.2) |
13 ( 54.2) |
24 (100.0) |
Table 6.4.1.16 : HbA1c (by Age, Type of Diabetes = Type 2)
| CMH Chi-Square |
p.value |
df |
| 4.6593 |
0.8629 |
9 |

|
Barplot 6.4.1.14 - HbA1c (by Age, Type of Diabetes = Type 2)

|
Barplot 6.4.1.14a - HbA1c (by Data Source, Age = <5, Type of Diabetes=Type 2)

|
Barplot 6.4.1.14b - HbA1c (by Data Source, Age = [5 - 10), Type of Diabetes=Type 2)

|
Barplot 6.4.1.14c - HbA1c (by Data Source, Age = [10 - 15), Type of Diabetes=Type 2)

|
Barplot 6.4.1.14d - HbA1c (by Data Source, Age = [15 - 18), Type of Diabetes=Type 2)
| HbA1c |
Gender * Age |
|
| Valid Value |
NV/NA |
|
Valid Value (%) |
NV/NA (%) |
Valid Value (%) |
NV/NA (%) |
|
| Valid Value |
25 ( 78.1) |
0 ( 0.0) |
0 ( 0.0) |
0 ( 0.0) |
25 ( 78.1) |
| NV/NA |
7 ( 21.9) |
0 ( 0.0) |
0 ( 0.0) |
0 ( 0.0) |
7 ( 21.9) |
|
32 (100.0) |
0 ( 0.0) |
0 ( 0.0) |
0 ( 0.0) |
32 (100.0) |
Table 6.4.1.17 : HbA1c (by Gender * Age, Type of Diabetes = Type 2)
| HbA1c |
Gender * Age |
|
| <5 |
[5 - 10) |
[10 - 15) |
[15 - 18) |
|
Male (%) |
Female (%) |
Male (%) |
Female (%) |
Male (%) |
Female (%) |
Male (%) |
Female (%) |
|
| <7 |
1 ( 33.3) |
3 ( 75.0) |
4 ( 44.4) |
3 ( 75.0) |
1 (100.0) |
2 (100.0) |
0 ( 0.0) |
1 (100.0) |
15 ( 62.5) |
| [7 - 7.5) |
0 ( 0.0) |
1 ( 25.0) |
1 ( 11.1) |
1 ( 25.0) |
0 ( 0.0) |
0 ( 0.0) |
0 ( 0.0) |
0 ( 0.0) |
3 ( 12.5) |
| [7.5 - 8.5) |
0 ( 0.0) |
0 ( 0.0) |
2 ( 22.2) |
0 ( 0.0) |
0 ( 0.0) |
0 ( 0.0) |
0 ( 0.0) |
0 ( 0.0) |
2 ( 8.3) |
| >=8.5 |
2 ( 66.7) |
0 ( 0.0) |
2 ( 22.2) |
0 ( 0.0) |
0 ( 0.0) |
0 ( 0.0) |
0 ( 0.0) |
0 ( 0.0) |
4 ( 16.7) |
|
3 ( 12.5) |
4 ( 16.7) |
9 ( 37.5) |
4 ( 16.7) |
1 ( 4.2) |
2 ( 8.3) |
0 ( 0.0) |
1 ( 4.2) |
24 (100.0) |
Table 6.4.1.18 : HbA1c (by Gender * Age, Type of Diabetes = Type 2)
| CMH Chi-Square |
p.value |
df |
| 50.6667 |
0.0144 |
31 |
| HbA1c |
Gender |
|
| Valid Value (%) |
NV/NA (%) |
|
| Valid Value |
21 ( 58.3) |
0 ( 0.0) |
21 ( 58.3) |
| NV/NA |
15 ( 41.7) |
0 ( 0.0) |
15 ( 41.7) |
|
36 (100.0) |
0 ( 0.0) |
36 (100.0) |
Table 6.4.1.19 : HbA1c (by Gender, Type of Diabetes = Other Type)
| CMH Chi-Square |
p.value |
df |
| 1 |
0.3173 |
1 |

|
Barplot 6.4.1.15 - HbA1c (by Gender, Type of Diabetes = Other Type)
| HbA1c |
Gender |
|
| Male (%) |
Female (%) |
|
| <7 |
8 ( 66.7) |
6 ( 66.7) |
14 ( 66.7) |
| [7 - 7.5) |
1 ( 8.3) |
1 ( 11.1) |
2 ( 9.5) |
| [7.5 - 8.5) |
2 ( 16.7) |
2 ( 22.2) |
4 ( 19.0) |
| >=8.5 |
1 ( 8.3) |
0 ( 0.0) |
1 ( 4.8) |
|
12 ( 57.1) |
9 ( 42.9) |
21 (100.0) |
Table 6.4.1.20 : HbA1c (by Gender, Type of Diabetes = Other Type)
| CMH Chi-Square |
p.value |
df |
| 0.875 |
0.8315 |
3 |

|
Barplot 6.4.1.16 - HbA1c (by Gender, Type of Diabetes = Other Type)

|
Barplot 6.4.1.16a - HbA1c (by Data Source, Gender = Male, Type of Diabetes=Other Type)

|
Barplot 6.4.1.16b - HbA1c (by Data Source, Gender = Female, Type of Diabetes=Other Type)
| HbA1c |
Age |
|
| Valid Value (%) |
NV/NA (%) |
|
| Valid Value |
21 ( 58.3) |
0 ( 0.0) |
21 ( 58.3) |
| NV/NA |
15 ( 41.7) |
0 ( 0.0) |
15 ( 41.7) |
|
36 (100.0) |
0 ( 0.0) |
36 (100.0) |
Table 6.4.1.21 : HbA1c (by Age, Type of Diabetes = Other Type)
| CMH Chi-Square |
p.value |
df |
| 1 |
0.3173 |
1 |

|
Barplot 6.4.1.17 - HbA1c (by Gender, Type of Diabetes = Other Type)
| HbA1c |
Age |
|
| <5 (%) |
[5 - 10) (%) |
[10 - 15) (%) |
[15 - 18) (%) |
|
| <7 |
1 ( 50.0) |
4 (100.0) |
7 ( 77.8) |
2 ( 33.3) |
14 ( 66.7) |
| [7 - 7.5) |
0 ( 0.0) |
0 ( 0.0) |
0 ( 0.0) |
2 ( 33.3) |
2 ( 9.5) |
| [7.5 - 8.5) |
1 ( 50.0) |
0 ( 0.0) |
2 ( 22.2) |
1 ( 16.7) |
4 ( 19.0) |
| >=8.5 |
0 ( 0.0) |
0 ( 0.0) |
0 ( 0.0) |
1 ( 16.7) |
1 ( 4.8) |
|
2 ( 9.5) |
4 ( 19.0) |
9 ( 42.9) |
6 ( 28.6) |
21 (100.0) |
Table 6.4.1.22 : HbA1c (by Age, Type of Diabetes = Other Type)
| CMH Chi-Square |
p.value |
df |
| 11.25 |
0.259 |
9 |

|
Barplot 6.4.1.18 - HbA1c (by Age, Type of Diabetes = Other Type)

|
Barplot 6.4.1.18a - HbA1c (by Data Source, Age = <5, Type of Diabetes=Other Type)

|
Barplot 6.4.1.18b - HbA1c (by Data Source, Age = [5 - 10), Type of Diabetes=Other Type)

|
Barplot 6.4.1.18c - HbA1c (by Data Source, Age = [10 - 15), Type of Diabetes=Other Type)

|
Barplot 6.4.1.18d - HbA1c (by Data Source, Age = [15 - 18), Type of Diabetes=Other Type)
| HbA1c |
Gender * Age |
|
| Valid Value |
NV/NA |
|
Valid Value (%) |
NV/NA (%) |
Valid Value (%) |
NV/NA (%) |
|
| Valid Value |
21 ( 58.3) |
0 ( 0.0) |
0 ( 0.0) |
0 ( 0.0) |
21 ( 58.3) |
| NV/NA |
15 ( 41.7) |
0 ( 0.0) |
0 ( 0.0) |
0 ( 0.0) |
15 ( 41.7) |
|
36 (100.0) |
0 ( 0.0) |
0 ( 0.0) |
0 ( 0.0) |
36 (100.0) |
Table 6.4.1.23 : HbA1c (by Gender * Age, Type of Diabetes = Other Type)
| HbA1c |
Gender * Age |
|
| <5 |
[5 - 10) |
[10 - 15) |
[15 - 18) |
|
Male (%) |
Female (%) |
Male (%) |
Female (%) |
Male (%) |
Female (%) |
Male (%) |
Female (%) |
|
| <7 |
2 ( 66.7) |
5 ( 83.3) |
2 ( 50.0) |
0 ( 0.0) |
1 (100.0) |
0 ( 0.0) |
1 (100.0) |
3 (100.0) |
14 ( 66.7) |
| [7 - 7.5) |
0 ( 0.0) |
0 ( 0.0) |
1 ( 25.0) |
1 ( 50.0) |
0 ( 0.0) |
0 ( 0.0) |
0 ( 0.0) |
0 ( 0.0) |
2 ( 9.5) |
| [7.5 - 8.5) |
1 ( 33.3) |
1 ( 16.7) |
1 ( 25.0) |
0 ( 0.0) |
0 ( 0.0) |
1 (100.0) |
0 ( 0.0) |
0 ( 0.0) |
4 ( 19.0) |
| >=8.5 |
0 ( 0.0) |
0 ( 0.0) |
0 ( 0.0) |
1 ( 50.0) |
0 ( 0.0) |
0 ( 0.0) |
0 ( 0.0) |
0 ( 0.0) |
1 ( 4.8) |
|
3 ( 14.3) |
6 ( 28.6) |
4 ( 19.0) |
2 ( 9.5) |
1 ( 4.8) |
1 ( 4.8) |
1 ( 4.8) |
3 ( 14.3) |
21 (100.0) |
Table 6.4.1.24 : HbA1c (by Gender * Age, Type of Diabetes = Other Type)
| CMH Chi-Square |
p.value |
df |
| 56.7143 |
0.0032 |
31 |

|
Trellis Barplot: 6.4.1.246 - HbA1c * Gender * Age (Type of Diabetes = Type 1)

|
Trellis Barplot: 6.4.1.247 - HbA1c * Gender * Age (Type of Diabetes = Type 2)

|
Trellis Barplot: 6.4.1.248 - HbA1c * Gender * Age (Type of Diabetes = Other Type)

|
Boxplot: 6.4.1.1 - HbA1c (by Type of Diabetes)

|
Boxplot: 6.4.1.2 - HbA1c (by Data source, Type of Diabetes = Type 1)

|
Boxplot: 6.4.1.3 - HbA1c (by Data source, Type of Diabetes = Type 2)

|
Boxplot: 6.4.1.4 - HbA1c (by Data source, Type of Diabetes = Other Type)

|
Boxplot: 6.4.1.5 - HbA1c (by Gender)

|
Boxplot: 6.4.1.6 - HbA1c (by Data source, Gender = Male)

|
Boxplot: 6.4.1.7 - HbA1c (by Data source, Gender = Female)

|
Boxplot: 6.4.1.8 - HbA1c (by Age)

|
Boxplot: 6.4.1.9 - HbA1c (by Data source, Age = <5)

|
Boxplot: 6.4.1.10 - HbA1c (by Data source, Age = [5 - 10))

|
Boxplot: 6.4.1.11 - HbA1c (by Data source, Age = [10 - 15))

|
Boxplot: 6.4.1.12 - HbA1c (by Data source, Age = [15 - 18))

|
Boxplot: 6.4.1.13 - HbA1c (by Gender, Type of Diabetes = Type 1)

|
Boxplot: 6.4.1.14 - HbA1c (by Data source, Gender = Male, Type of Diabetes = Type 1)

|
Boxplot: 6.4.1.15 - HbA1c (by Data source, Gender = Female, Type of Diabetes = Type 1)

|
Boxplot: 6.4.1.16 - HbA1c (by Age, Type of Diabetes = Type 1)

|
Boxplot: 6.4.1.17 - HbA1c (by Data source, Age = <5, Type of Diabetes = Type 1)

|
Boxplot: 6.4.1.18 - HbA1c (by Data source, Age = [5 - 10), Type of Diabetes = Type 1)

|
Boxplot: 6.4.1.19 - HbA1c (by Data source, Age = [10 - 15), Type of Diabetes = Type 1)

|
Boxplot: 6.4.1.20 - HbA1c (by Data source, Age = [15 - 18), Type of Diabetes = Type 1)
|
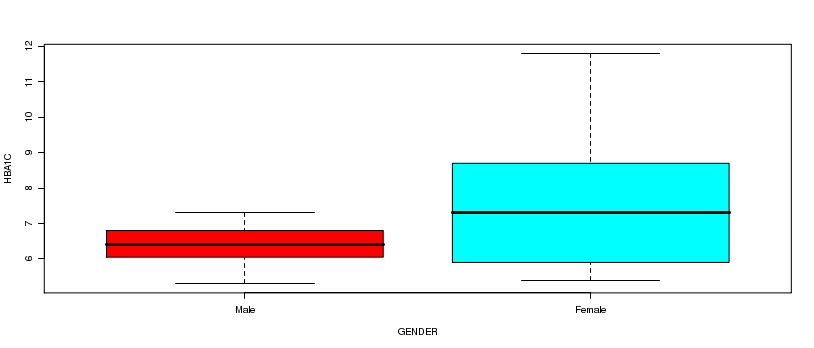
Boxplot: 6.4.1.21 - HbA1c (by Gender, Type of Diabetes = Type 2)

|
Boxplot: 6.4.1.22 - HbA1c (by Data source, Gender = Male, Type of Diabetes = Type 2)

|
Boxplot: 6.4.1.23 - HbA1c (by Data source, Gender = Female, Type of Diabetes = Type 2)

|
Boxplot: 6.4.1.24 - HbA1c (by Age, Type of Diabetes = Type 2)

|
Boxplot: 6.4.1.25 - HbA1c (by Data source, Age = [15 - 18), Type of Diabetes = Type 2)

|
Boxplot: 6.4.1.26 - HbA1c (by Data source, Age = [5 - 10), Type of Diabetes = Type 2)

|
Boxplot: 6.4.1.27 - HbA1c (by Data source, Age = <5, Type of Diabetes = Type 2)

|
Boxplot: 6.4.1.28 - HbA1c (by Data source, Age = [10 - 15), Type of Diabetes = Type 2)

|
Boxplot: 6.4.1.29 - HbA1c (by Gender, Type of Diabetes = Other Type)

|
Boxplot: 6.4.1.30 - HbA1c (by Data source, Gender = Male, Type of Diabetes = Other Type)

|
Boxplot: 6.4.1.31 - HbA1c (by Data source, Gender = Female, Type of Diabetes = Other Type)

|
Boxplot: 6.4.1.32 - HbA1c (by Age, Type of Diabetes = Other Type)

|
Boxplot: 6.4.1.33 - HbA1c (by Data source, Age = [5 - 10), Type of Diabetes = Other Type)

|
Boxplot: 6.4.1.34 - HbA1c (by Data source, Age = [10 - 15), Type of Diabetes = Other Type)

|
Boxplot: 6.4.1.35 - HbA1c (by Data source, Age = [15 - 18), Type of Diabetes = Other Type)

|
Boxplot: 6.4.1.36 - HbA1c (by Data source, Age = <5, Type of Diabetes = Other Type)

|
Trellis Boxplot: 6.4.1.37 - HbA1c * Gender * Age (Type of Diabetes = Type 1)

|
Trellis Boxplot: 6.4.1.38 - HbA1c * Gender * Age (Type of Diabetes = Type 2)

|
Trellis Boxplot: 6.4.1.39 - HbA1c * Gender * Age (Type of Diabetes = Other Type)
