| BMI |
Valid Value (%) |
NV/NA (%) |
|
| Valid Value |
1071 ( 80.6) |
0 ( 0.0) |
1071 ( 80.6) |
| NV/NA |
258 ( 19.4) |
0 ( 0.0) |
258 ( 19.4) |
|
1329 (100.0) |
0 ( 0.0) |
1329 (100.0) |
Table 6.3.2.1 : BMI (by Type of Diabetes)
| CMH Chi-Square |
p.value |
df |
| 497.3431 |
0 |
1 |

|
Barplot 6.3.2.1 - BMI (by Type of Diabetes)
| BMI |
Type 1 (%) |
Type 2 (%) |
Other Type (%) |
|
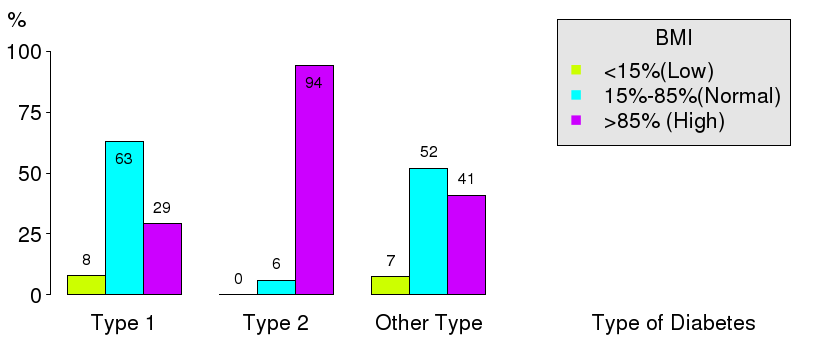
| <15%(Low) |
80 ( 7.8) |
0 ( 0.0) |
2 ( 7.4) |
82 ( 7.7) |
| 15%-85%(Normal) |
645 ( 63.0) |
1 ( 5.9) |
14 ( 51.9) |
660 ( 61.9) |
| >85% (High) |
298 ( 29.1) |
16 ( 94.1) |
11 ( 40.7) |
325 ( 30.5) |
|
1023 ( 95.9) |
17 ( 1.6) |
27 ( 2.5) |
1067 (100.0) |
Table 6.3.2.2 : BMI (by Type of Diabetes)
| CMH Chi-Square |
p.value |
df |
| 34.7645 |
0 |
4 |
|
Barplot 6.3.2.2 - BMI (by Type of Diabetes)
|
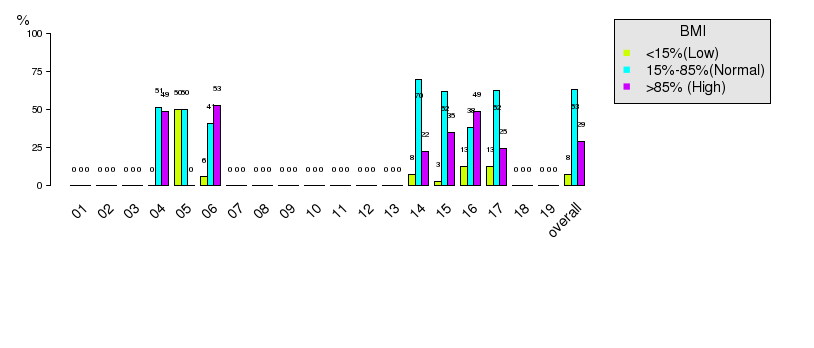
Barplot 6.3.2.2a - BMI (by Data Source, Type of Diabetes = Type 1)

|
Barplot 6.3.2.2b - BMI (by Data Source, Type of Diabetes = Type 2)

|
Barplot 6.3.2.2c - BMI (by Data Source, Type of Diabetes = Other Type)
