
|
| BIRO Report site: 319761ea64b939fa1be95f0c7eb6e8c07691f006 |
| Reference date: 18/02/12 |
| Parameter: 6.2.2 Duration of diabetes (Classes) |
| Duration of Diabetes | Valid Value (%) | NV/NA (%) | |
|---|---|---|---|
| Valid Value | 1843 (100.0) | 0 ( 0.0) | 1843 (100.0) |
| NV/NA | 0 ( 0.0) | 0 ( 0.0) | 0 ( 0.0) |
| 1843 (100.0) | 0 ( 0.0) | 1843 (100.0) |
| CMH Chi-Square |
|---|
| Too many cells have 0 obs |

|
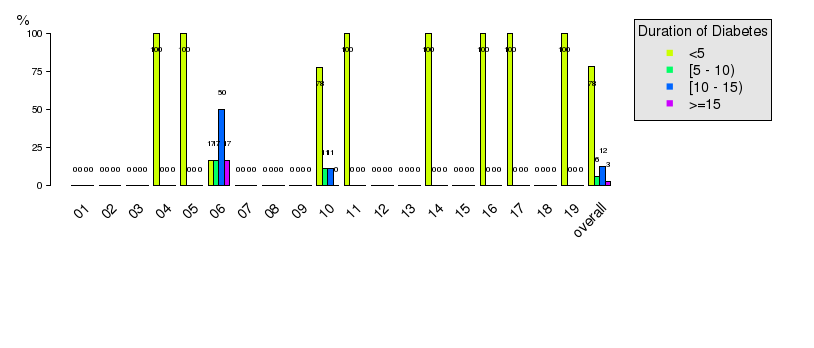
| Duration of Diabetes | Type 1 (%) | Type 2 (%) | Other Type (%) | |
|---|---|---|---|---|
| <5 | 1103 ( 62.1) | 25 ( 78.1) | 31 ( 86.1) | 1159 ( 62.9) |
| [5 - 10) | 522 ( 29.4) | 2 ( 6.2) | 4 ( 11.1) | 528 ( 28.6) |
| [10 - 15) | 134 ( 7.5) | 4 ( 12.5) | 1 ( 2.8) | 139 ( 7.5) |
| >=15 | 16 ( 0.9) | 1 ( 3.1) | 0 ( 0.0) | 17 ( 0.9) |
| 1775 ( 96.3) | 32 ( 1.7) | 36 ( 2.0) | 1843 (100.0) |
| CMH Chi-Square | p.value | df |
|---|---|---|
| 18.4028 | 0.0053 | 6 |

|

|
|

|
| Duration of Diabetes | Valid Value (%) | NV/NA (%) | |
|---|---|---|---|
| Valid Value | 1843 (100.0) | 0 ( 0.0) | 1843 (100.0) |
| NV/NA | 0 ( 0.0) | 0 ( 0.0) | 0 ( 0.0) |
| 1843 (100.0) | 0 ( 0.0) | 1843 (100.0) |
| CMH Chi-Square |
|---|
| Too many cells have 0 obs |

|
| Duration of Diabetes | Male (%) | Female (%) | |
|---|---|---|---|
| <5 | 623 ( 65.9) | 536 ( 59.7) | 1159 ( 62.9) |
| [5 - 10) | 252 ( 26.7) | 276 ( 30.7) | 528 ( 28.6) |
| [10 - 15) | 60 ( 6.3) | 79 ( 8.8) | 139 ( 7.5) |
| >=15 | 10 ( 1.1) | 7 ( 0.8) | 17 ( 0.9) |
| 945 ( 51.3) | 898 ( 48.7) | 1843 (100.0) |
| CMH Chi-Square | p.value | df |
|---|---|---|
| 9.5557 | 0.0227 | 3 |

|

|

|
| Duration of Diabetes | Gender | ||
|---|---|---|---|
| Valid Value (%) | NV/NA (%) | ||
| Valid Value | 1775 (100.0) | 0 ( 0.0) | 1775 (100.0) |
| NV/NA | 0 ( 0.0) | 0 ( 0.0) | 0 ( 0.0) |
| 1775 (100.0) | 0 ( 0.0) | 1775 (100.0) |
| CMH Chi-Square |
|---|
| Too many cells have 0 obs |

|
| Duration of Diabetes | Gender | ||
|---|---|---|---|
| Male (%) | Female (%) | ||
| <5 | 592 ( 65.1) | 511 ( 59.0) | 1103 ( 62.1) |
| [5 - 10) | 249 ( 27.4) | 273 ( 31.5) | 522 ( 29.4) |
| [10 - 15) | 58 ( 6.4) | 76 ( 8.8) | 134 ( 7.5) |
| >=15 | 10 ( 1.1) | 6 ( 0.7) | 16 ( 0.9) |
| 909 ( 51.2) | 866 ( 48.8) | 1775 (100.0) |
| CMH Chi-Square | p.value | df |
|---|---|---|
| 9.4335 | 0.024 | 3 |

|

|

|
| Duration of Diabetes | Gender | ||
|---|---|---|---|
| Valid Value (%) | NV/NA (%) | ||
| Valid Value | 32 (100.0) | 0 ( 0.0) | 32 (100.0) |
| NV/NA | 0 ( 0.0) | 0 ( 0.0) | 0 ( 0.0) |
| 32 (100.0) | 0 ( 0.0) | 32 (100.0) |
| CMH Chi-Square |
|---|
| Too many cells have 0 obs |

|
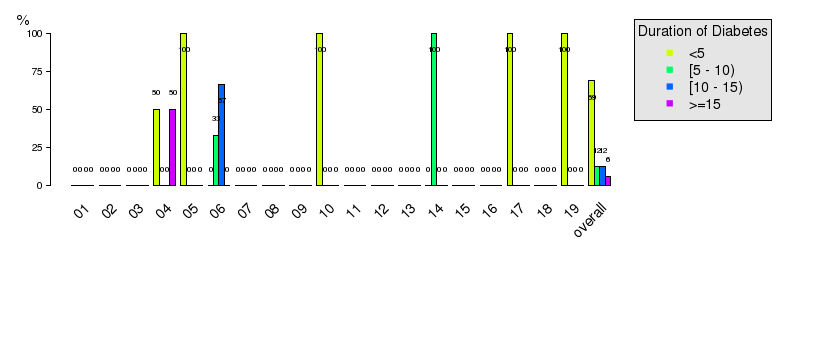
| Duration of Diabetes | Gender | ||
|---|---|---|---|
| Male (%) | Female (%) | ||
| <5 | 13 ( 81.2) | 12 ( 75.0) | 25 ( 78.1) |
| [5 - 10) | 1 ( 6.2) | 1 ( 6.2) | 2 ( 6.2) |
| [10 - 15) | 2 ( 12.5) | 2 ( 12.5) | 4 ( 12.5) |
| >=15 | 0 ( 0.0) | 1 ( 6.2) | 1 ( 3.1) |
| 16 ( 50.0) | 16 ( 50.0) | 32 (100.0) |
| CMH Chi-Square | p.value | df |
|---|---|---|
| 1.04 | 0.7916 | 3 |

|
|

|
| Duration of Diabetes | Gender | ||
|---|---|---|---|
| Valid Value (%) | NV/NA (%) | ||
| Valid Value | 36 (100.0) | 0 ( 0.0) | 36 (100.0) |
| NV/NA | 0 ( 0.0) | 0 ( 0.0) | 0 ( 0.0) |
| 36 (100.0) | 0 ( 0.0) | 36 (100.0) |
| CMH Chi-Square |
|---|
| Too many cells have 0 obs |

|
| Duration of Diabetes | Gender | ||
|---|---|---|---|
| Male (%) | Female (%) | ||
| <5 | 18 ( 90.0) | 13 ( 81.2) | 31 ( 86.1) |
| [5 - 10) | 2 ( 10.0) | 2 ( 12.5) | 4 ( 11.1) |
| [10 - 15) | 0 ( 0.0) | 1 ( 6.2) | 1 ( 2.8) |
| >=15 | 0 ( 0.0) | 0 ( 0.0) | 0 ( 0.0) |
| 20 ( 55.6) | 16 ( 44.4) | 36 (100.0) |
| CMH Chi-Square | p.value | df |
|---|---|---|
| 1.379 | 0.5018 | 2 |

|

|

|
| Copyright BIRO Consortium |