| ESRF |
Valid Value (%) |
NV/NA (%) |
|
| Valid Value |
106564 ( 66.1) |
0 ( 0.0) |
106564 ( 66.1) |
| NV/NA |
54537 ( 33.9) |
0 ( 0.0) |
54537 ( 33.9) |
|
161101 (100.0) |
0 ( 0.0) |
161101 (100.0) |
Table 5.4.2.1 : ESRF (by Type of Diabetes)
| CMH Chi-Square |
p.value |
df |
| 16801.9362 |
0 |
1 |

|
Barplot 5.4.2.1 - ESRF (by Type of Diabetes)
| ESRF |
Type 1 (%) |
Type 2 (%) |
|
| Yes |
159 ( 1.8) |
1341 ( 1.4) |
1500 ( 1.4) |
| No |
8616 ( 98.2) |
96448 ( 98.6) |
105064 ( 98.6) |
|
8775 ( 8.2) |
97789 ( 91.8) |
106564 (100.0) |
Table 5.4.2.2 : ESRF (by Type of Diabetes)
| CMH Chi-Square |
p.value |
df |
| 10.951 |
9e-04 |
1 |

|
Barplot 5.4.2.2 - ESRF (by Type of Diabetes)

|
Barplot 5.4.2.2a - ESRF (by Data Source, Type of Diabetes = Type 1)

|
Barplot 5.4.2.2b - ESRF (by Data Source, Type of Diabetes = Type 2)
| s |
O |
E |
N |
CR |
AR |
C.I. (95%) |
[O-E]/E % |
C.I. [O-E]/E (95%) |
| 01 |
1 |
0 |
45 |
2.2 |
100.0 |
( 0.0;100.0) |
Inf |
( -Inf; Inf) |
| 04 |
17 |
0 |
17 |
100.0 |
100.0 |
( 0.0;100.0) |
Inf |
( -Inf; Inf) |
| 08 |
1 |
0 |
51 |
2.0 |
100.0 |
( 0.0;100.0) |
Inf |
( -Inf; Inf) |
| 10 |
30 |
7 |
451 |
6.7 |
7.8 |
( 6.3; 9.3) |
328.6 |
( 232.5;424.6) |
| 12 |
65 |
58 |
3221 |
2.0 |
2.0 |
( 1.6; 2.5) |
12.1 |
( -14.2; 38.3) |
| 17 |
34 |
41 |
2528 |
1.3 |
1.5 |
( 1.0; 2.1) |
-17.1 |
( -51.0; 16.8) |
| 06 |
6 |
9 |
813 |
0.7 |
1.2 |
( -0.2; 2.7) |
-33.3 |
(-164.7; 98.0) |
| 16 |
5 |
27 |
1619 |
0.3 |
0.3 |
( -0.4; 1.0) |
-81.5 |
(-124.2;-38.8) |
| T |
159 |
|
8745 |
1.8 |
|
|
|
|
Table 5.4.2.3 - Standardized Estimates:
5.4.2 End stage renal failure in adults
(Type of Diabetes = Type 1 )

|
Barplots (Adjusted Rates): 5.4.2.1 5.4.2 End stage renal failure in adults - Type of Diabetes = Type 1
|
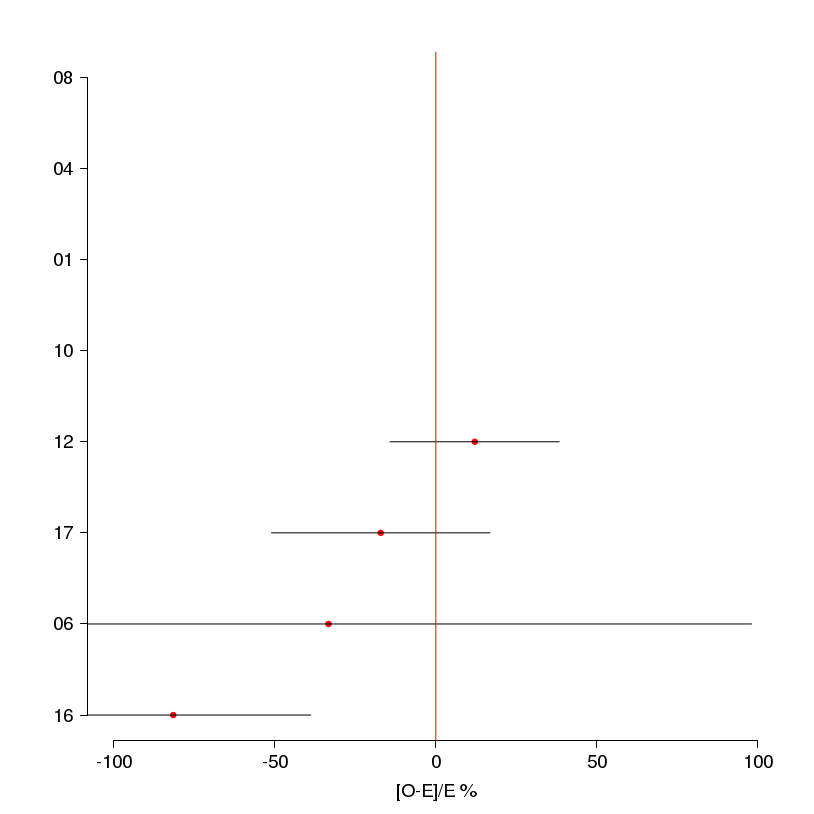
Forest plots: 5.4.2.1 5.4.2 End stage renal failure in adults - Type of Diabetes = Type 1
| s |
O |
E |
N |
CR |
AR |
C.I. (95%) |
[O-E]/E % |
C.I. [O-E]/E (95%) |
| 04 |
576 |
21 |
576 |
100.0 |
37.6 |
( 37.0; 38.2) |
2642.9 |
(2627.3;2658.4) |
| 10 |
239 |
65 |
3441 |
6.9 |
5.0 |
( 4.7; 5.4) |
267.7 |
( 250.3; 285.1) |
| 12 |
226 |
160 |
6896 |
3.3 |
1.9 |
( 1.7; 2.1) |
41.2 |
( 32.2; 50.3) |
| 08 |
11 |
11 |
707 |
1.6 |
1.4 |
( 0.5; 2.2) |
0.0 |
( -54.1; 54.1) |
| 17 |
217 |
548 |
50927 |
0.4 |
0.5 |
( 0.4; 0.7) |
-60.4 |
( -70.9; -49.9) |
| 06 |
53 |
222 |
12638 |
0.4 |
0.3 |
( 0.1; 0.5) |
-76.1 |
( -86.2; -66.0) |
| 01 |
1 |
8 |
579 |
0.2 |
0.2 |
( -0.9; 1.2) |
-87.5 |
(-164.7; -10.3) |
| 13 |
8 |
52 |
4194 |
0.2 |
0.2 |
( -0.2; 0.6) |
-84.6 |
(-114.8; -54.4) |
| 16 |
10 |
245 |
17831 |
0.1 |
0.1 |
( -0.1; 0.2) |
-95.9 |
(-108.2; -83.6) |
| T |
1341 |
|
97789 |
1.4 |
|
|
|
|
Table 5.4.2.4 - Standardized Estimates:
5.4.2 End stage renal failure in adults
(Type of Diabetes = Type 2 )

|
Barplots (Adjusted Rates): 5.4.2.2 5.4.2 End stage renal failure in adults - Type of Diabetes = Type 2

|
Forest plots: 5.4.2.2 5.4.2 End stage renal failure in adults - Type of Diabetes = Type 2
