| Dialysis and or Transplantation |
Valid Value (%) |
NV/NA (%) |
|
| Valid Value |
21861 ( 86.8) |
0 ( 0.0) |
21861 ( 86.8) |
| NV/NA |
3325 ( 13.2) |
0 ( 0.0) |
3325 ( 13.2) |
|
25186 (100.0) |
0 ( 0.0) |
25186 (100.0) |
Table 5.4.1.1 : Dialysis and or Transplantation (by Type of Diabetes)
| CMH Chi-Square |
p.value |
df |
| 13641.8366 |
0 |
1 |

|
Barplot 5.4.1.1 - Dialysis and or Transplantation (by Type of Diabetes)
| Dialysis and or Transplantation |
Type 1 (%) |
Type 2 (%) |
|
| Yes |
17 ( 0.8) |
14 ( 0.1) |
31 ( 0.1) |
| No |
2230 ( 99.2) |
19600 ( 99.9) |
21830 ( 99.9) |
|
2247 ( 10.3) |
19614 ( 89.7) |
21861 (100.0) |
Table 5.4.1.2 : Dialysis and or Transplantation (by Type of Diabetes)
| CMH Chi-Square |
p.value |
df |
| 62.0896 |
0 |
1 |

|
Barplot 5.4.1.2 - Dialysis and or Transplantation (by Type of Diabetes)

|
Barplot 5.4.1.2a - Dialysis and or Transplantation (by Data Source, Type of Diabetes = Type 1)

|
Barplot 5.4.1.2b - Dialysis and or Transplantation (by Data Source, Type of Diabetes = Type 2)
| s |
O |
E |
N |
CR |
AR |
C.I. (95%) |
[O-E]/E % |
C.I. [O-E]/E (95%) |
| 19 |
12 |
5 |
554 |
2.2 |
1.8 |
( 1.1; 2.5) |
140.0 |
( 63.4;216.6) |
| 16 |
5 |
11 |
1619 |
0.3 |
0.3 |
( -0.1; 0.8) |
-54.5 |
(-120.5; 11.4) |
| T |
17 |
|
2173 |
0.8 |
|
|
|
|
Table 5.4.1.3 - Standardized Estimates:
5.4.1 Annual incidence of dialysis and/or transplant among adults
(Type of Diabetes = Type 1 )
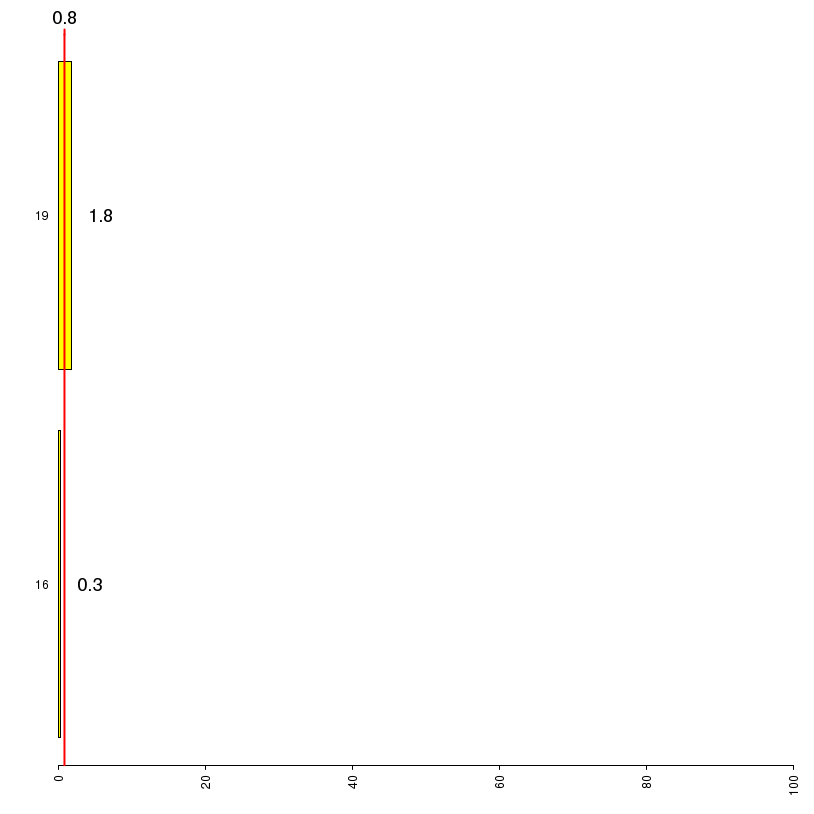
|
Barplots (Adjusted Rates): 5.4.1.1 5.4.1 Annual incidence of dialysis and/or transplant among adults - Type of Diabetes = Type 1

|
Forest plots: 5.4.1.1 5.4.1 Annual incidence of dialysis and/or transplant among adults - Type of Diabetes = Type 1
| s |
O |
E |
N |
CR |
AR |
C.I. (95%) |
[O-E]/E % |
C.I. [O-E]/E (95%) |
| 19 |
4 |
0 |
1204 |
0.3 |
100.0 |
( 0.0;100.0) |
Inf |
( -Inf; Inf ) |
| 16 |
10 |
12 |
17831 |
0.1 |
0.1 |
( 0.0; 0.1) |
-16.7 |
(-77.0;43.7 ) |
| T |
14 |
|
19035 |
0.1 |
|
|
|
|
Table 5.4.1.4 - Standardized Estimates:
5.4.1 Annual incidence of dialysis and/or transplant among adults
(Type of Diabetes = Type 2 )

|
Barplots (Adjusted Rates): 5.4.1.2 5.4.1 Annual incidence of dialysis and/or transplant among adults - Type of Diabetes = Type 2

|
Forest plots: 5.4.1.2 5.4.1 Annual incidence of dialysis and/or transplant among adults - Type of Diabetes = Type 2
