
|
| BIRO Report site: 319761ea64b939fa1be95f0c7eb6e8c07691f006 |
| Reference date: 18/02/12 |
| Parameter: 5.3.5 Percentage of adults w normal microalb. in 12 mts (among tested) |
| Microalbuminuria | Valid Value (%) | NV/NA (%) | |
|---|---|---|---|
| Valid Value | 43595 (100.0) | 0 ( 0.0) | 43595 (100.0) |
| NV/NA | 0 ( 0.0) | 0 ( 0.0) | 0 ( 0.0) |
| 43595 (100.0) | 0 ( 0.0) | 43595 (100.0) |
| CMH Chi-Square |
|---|
| Too many cells have 0 obs |

|
| Microalbuminuria | Type 1 (%) | Type 2 (%) | |
|---|---|---|---|
| MA Test Normal | 6505 ( 88.7) | 31011 ( 85.5) | 37516 ( 86.1) |
| MA Test Abnormal | 825 ( 11.3) | 5254 ( 14.5) | 6079 ( 13.9) |
| 7330 ( 16.8) | 36265 ( 83.2) | 43595 (100.0) |
| CMH Chi-Square | p.value | df |
|---|---|---|
| 52.8323 | 0 | 1 |

|

|

|
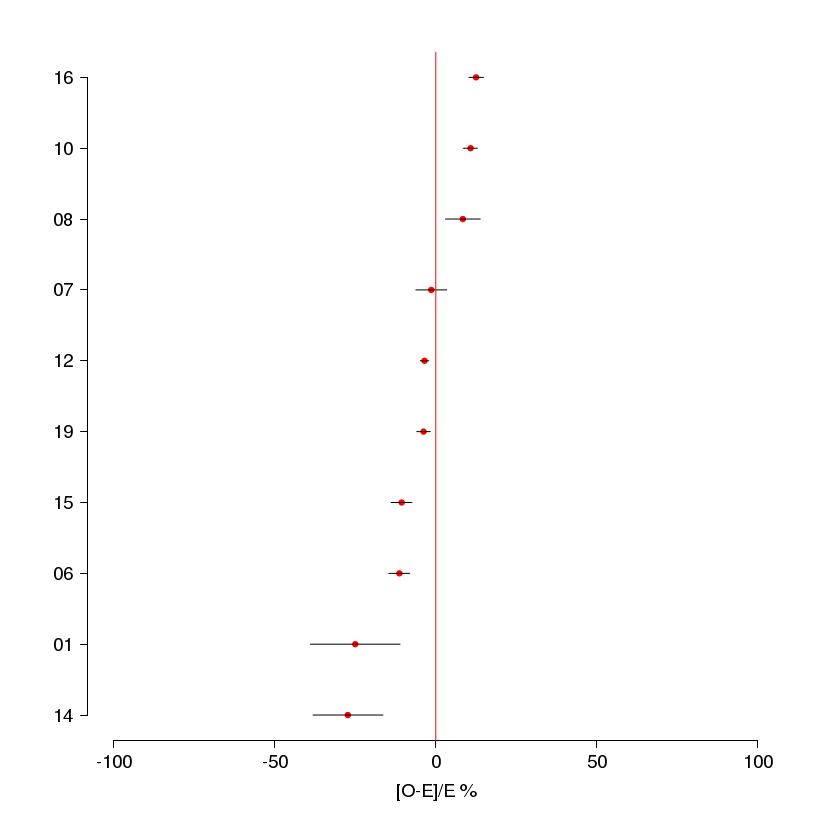
| s | O | E | N | CR | AR | C.I. (95%) | [O-E]/E % | C.I. [O-E]/E (95%) |
|---|---|---|---|---|---|---|---|---|
| 16 | 934 | 830 | 934 | 100.0 | 100.0 | ( 98.0;100.0) | 12.5 | ( 10.3; 14.8) |
| 10 | 967 | 873 | 982 | 98.5 | 98.5 | ( 96.5;100.0) | 10.8 | ( 8.6; 12.9) |
| 08 | 155 | 143 | 160 | 96.9 | 96.3 | ( 91.5;100.0) | 8.4 | ( 3.0; 13.8) |
| 07 | 145 | 147 | 160 | 90.6 | 87.7 | ( 83.3; 92.1) | -1.4 | ( -6.2; 3.4) |
| 12 | 2436 | 2524 | 2841 | 85.7 | 85.8 | ( 84.6; 86.9) | -3.5 | ( -4.8; -2.2) |
| 19 | 1030 | 1071 | 1216 | 84.7 | 85.5 | ( 83.6; 87.3) | -3.8 | ( -5.9; -1.7) |
| 15 | 269 | 301 | 327 | 82.3 | 79.4 | ( 76.4; 82.4) | -10.6 | (-13.9; -7.4) |
| 06 | 352 | 397 | 447 | 78.7 | 78.8 | ( 75.9; 81.7) | -11.3 | (-14.6; -8.1) |
| 01 | 12 | 16 | 16 | 75.0 | 66.7 | ( 52.7; 80.6) | -25.0 | (-38.9;-11.1) |
| 14 | 16 | 22 | 23 | 69.6 | 64.6 | ( 54.3; 75.0) | -27.3 | (-38.1;-16.4) |
| T | 6316 | 7106 | 88.9 |

|
|
| s | O | E | N | CR | AR | C.I. (95%) | [O-E]/E % | C.I. [O-E]/E (95%) |
|---|---|---|---|---|---|---|---|---|
| 16 | 12320 | 10765 | 12337 | 99.9 | 98.4 | ( 97.8; 99.0) | 14.4 | ( 13.8; 15.1) |
| 10 | 6987 | 6192 | 7208 | 96.9 | 97.0 | ( 96.2; 97.8) | 12.8 | ( 11.9; 13.8) |
| 08 | 684 | 640 | 744 | 91.9 | 91.9 | ( 89.4; 94.3) | 6.9 | ( 4.0; 9.7) |
| 19 | 1153 | 1239 | 1451 | 79.5 | 80.0 | ( 78.2; 81.8) | -6.9 | ( -9.1; -4.8) |
| 12 | 4273 | 4821 | 5762 | 74.2 | 76.2 | ( 75.2; 77.2) | -11.4 | (-12.5;-10.2) |
| 01 | 228 | 262 | 305 | 74.8 | 74.8 | ( 70.9; 78.7) | -13.0 | (-17.5; -8.5) |
| 15 | 1124 | 1441 | 1631 | 68.9 | 67.1 | ( 65.5; 68.6) | -22.0 | (-23.7;-20.3) |
| 06 | 2620 | 3471 | 4099 | 63.9 | 64.9 | ( 63.8; 66.0) | -24.5 | (-25.8;-23.2) |
| 13 | 1238 | 1809 | 2092 | 59.2 | 58.8 | ( 57.4; 60.3) | -31.6 | (-33.2;-29.9) |
| T | 30627 | 35629 | 86.0 |

|

|
| Copyright BIRO Consortium |