| BMI |
Valid Value (%) |
NV/NA (%) |
|
| Valid Value |
137473 ( 85.6) |
0 ( 0.0) |
137473 ( 85.6) |
| NV/NA |
23191 ( 14.4) |
0 ( 0.0) |
23191 ( 14.4) |
|
160664 (100.0) |
0 ( 0.0) |
160664 (100.0) |
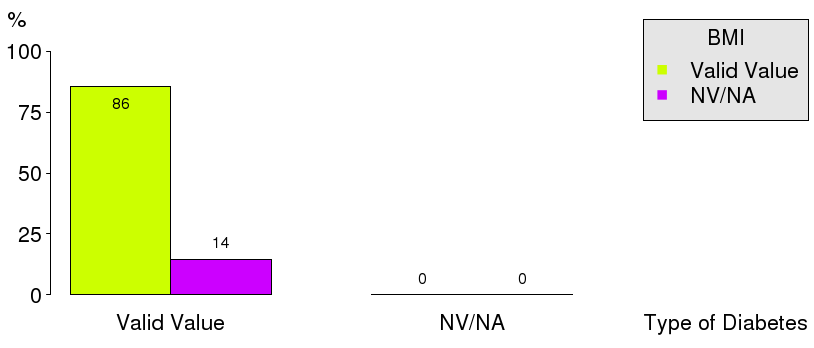
Table 5.3.4.1 : BMI (by Type of Diabetes)
| CMH Chi-Square |
p.value |
df |
| 81289.9936 |
0 |
1 |
|
Barplot 5.3.4.1 - BMI (by Type of Diabetes)
| BMI |
Type 1 (%) |
Type 2 (%) |
|
| <30 |
11184 ( 84.4) |
59479 ( 47.9) |
70663 ( 51.4) |
| >=30 |
2075 ( 15.6) |
64735 ( 52.1) |
66810 ( 48.6) |
|
13259 ( 9.6) |
124214 ( 90.4) |
137473 (100.0) |
Table 5.3.4.2 : BMI (by Type of Diabetes)
| CMH Chi-Square |
p.value |
df |
| 6375.8924 |
0 |
1 |

|
Barplot 5.3.4.2 - BMI (by Type of Diabetes)

|
Barplot 5.3.4.2a - BMI (by Data Source, Type of Diabetes = Type 1)

|
Barplot 5.3.4.2b - BMI (by Data Source, Type of Diabetes = Type 2)
| s |
O |
E |
N |
CR |
AR |
C.I. (95%) |
[O-E]/E % |
C.I. [O-E]/E (95%) |
| 01 |
12 |
3 |
45 |
26.7 |
62.6 |
( 38.8; 86.4) |
300.0 |
( -57.6;657.6) |
| 15 |
97 |
63 |
460 |
21.1 |
24.1 |
( 20.5; 27.7) |
54.0 |
( 27.7; 80.2) |
| 16 |
338 |
224 |
1421 |
23.8 |
23.6 |
( 21.8; 25.5) |
50.9 |
( 39.1; 62.7) |
| 05 |
3 |
2 |
19 |
15.8 |
23.5 |
( 1.0; 46.0) |
50.0 |
( -163.9;263.9) |
| 17 |
339 |
293 |
1843 |
18.4 |
18.1 |
( 16.5; 19.7) |
15.7 |
( 5.5; 25.9) |
| 19 |
269 |
253 |
1717 |
15.7 |
16.6 |
( 14.9; 18.4) |
6.3 |
( -5.7; 18.4) |
| 03 |
14 |
14 |
114 |
12.3 |
15.6 |
( 7.4; 23.9) |
0.0 |
( -66.9; 66.9) |
| 12 |
507 |
518 |
3139 |
16.2 |
15.3 |
( 14.1; 16.5) |
-2.1 |
( -9.5; 5.3) |
| 06 |
170 |
232 |
1446 |
11.8 |
11.5 |
( 9.6; 13.3) |
-26.7 |
( -38.1;-15.4) |
| 18 |
29 |
40 |
212 |
13.7 |
11.3 |
( 6.9; 15.7) |
-27.5 |
( -50.8; -4.2) |
| 04 |
297 |
422 |
2817 |
10.5 |
11.0 |
( 9.7; 12.4) |
-29.6 |
( -38.7;-20.5) |
| 14 |
0 |
1 |
26 |
0.0 |
0.0 |
(-36.7; 36.7) |
-100.0 |
(-1054.1;854.1) |
| T |
2075 |
|
13259 |
15.6 |
|
|
|
|
Table 5.3.4.3 - Standardized Estimates:
5.3.4 Percentage of adults w most recent BMI>30
(Type of Diabetes = Type 1 )

|
Barplots (Adjusted Rates): 5.3.4.1 5.3.4 Percentage of adults w most recent BMI>30 - Type of Diabetes = Type 1

|
Forest plots: 5.3.4.1 5.3.4 Percentage of adults w most recent BMI>30 - Type of Diabetes = Type 1
| s |
O |
E |
N |
CR |
AR |
C.I. (95%) |
[O-E]/E % |
C.I. [O-E]/E (95%) |
| 17 |
26653 |
23172 |
42325 |
63.0 |
60.0 |
( 59.5; 60.4) |
15.0 |
( 14.2; 15.8) |
| 12 |
3615 |
3242 |
6648 |
54.4 |
58.1 |
( 56.9; 59.4) |
11.5 |
( 8.9; 14.1) |
| 03 |
66 |
60 |
108 |
61.1 |
57.3 |
( 48.7; 66.0) |
10.0 |
( -5.5; 25.5) |
| 01 |
387 |
355 |
684 |
56.6 |
56.8 |
( 53.2; 60.5) |
9.0 |
( 1.9; 16.1) |
| 16 |
8485 |
7996 |
15836 |
53.6 |
55.3 |
( 54.5; 56.1) |
6.1 |
( 4.6; 7.7) |
| 15 |
1132 |
1096 |
2025 |
55.9 |
53.8 |
( 51.8; 55.9) |
3.3 |
( -0.5; 7.1) |
| 06 |
9703 |
10886 |
20856 |
46.5 |
46.5 |
( 45.8; 47.1) |
-10.9 |
(-12.1; -9.6) |
| 05 |
912 |
1024 |
1761 |
51.8 |
46.4 |
( 44.4; 48.5) |
-10.9 |
(-14.4; -7.4) |
| 19 |
1077 |
1242 |
2423 |
44.4 |
45.2 |
( 43.2; 47.2) |
-13.3 |
(-17.1; -9.4) |
| 13 |
2138 |
2510 |
4814 |
44.4 |
44.4 |
( 43.0; 45.8) |
-14.8 |
(-17.5;-12.2) |
| 18 |
2880 |
3448 |
6940 |
41.5 |
43.5 |
( 42.3; 44.7) |
-16.5 |
(-18.9;-14.1) |
| 04 |
7711 |
9734 |
19794 |
39.0 |
41.3 |
( 40.6; 42.0) |
-20.8 |
(-22.2;-19.3) |
| T |
64759 |
|
124214 |
52.1 |
|
|
|
|
Table 5.3.4.4 - Standardized Estimates:
5.3.4 Percentage of adults w most recent BMI>30
(Type of Diabetes = Type 2 )

|
Barplots (Adjusted Rates): 5.3.4.2 5.3.4 Percentage of adults w most recent BMI>30 - Type of Diabetes = Type 2

|
Forest plots: 5.3.4.2 5.3.4 Percentage of adults w most recent BMI>30 - Type of Diabetes = Type 2
