| BP |
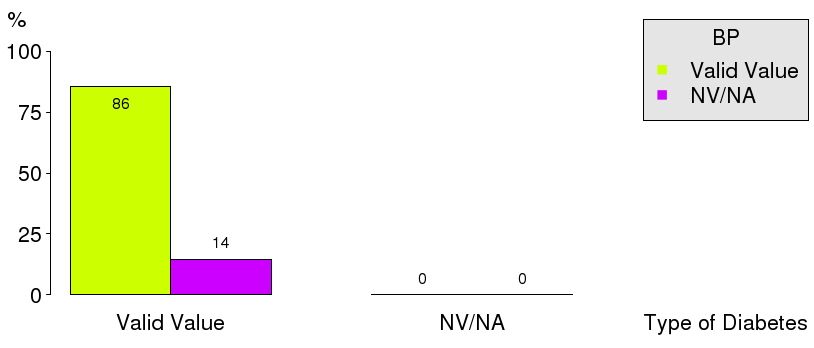
Valid Value (%) |
NV/NA (%) |
|
| Valid Value |
163547 ( 85.6) |
0 ( 0.0) |
163547 ( 85.6) |
| NV/NA |
27623 ( 14.4) |
0 ( 0.0) |
27623 ( 14.4) |
|
191170 (100.0) |
0 ( 0.0) |
191170 (100.0) |
Table 5.3.3.1 : BP (by Type of Diabetes)
| CMH Chi-Square |
p.value |
df |
| 96643.4785 |
0 |
1 |
|
Barplot 5.3.3.1 - BP (by Type of Diabetes)
| BP |
Type 1 (%) |
Type 2 (%) |
|
| <=140/90] |
12715 ( 80.6) |
94628 ( 64.0) |
107343 ( 65.6) |
| >140/90 |
3060 ( 19.4) |
53144 ( 36.0) |
56204 ( 34.4) |
|
15775 ( 9.6) |
147772 ( 90.4) |
163547 (100.0) |
Table 5.3.3.2 : BP (by Type of Diabetes)
| CMH Chi-Square |
p.value |
df |
| 1733.4062 |
0 |
1 |

|
Barplot 5.3.3.2 - BP (by Type of Diabetes)

|
Barplot 5.3.3.2a - BP (by Data Source, Type of Diabetes = Type 1)

|
Barplot 5.3.3.2b - BP (by Data Source, Type of Diabetes = Type 2)
| s |
O |
E |
N |
CR |
AR |
C.I. (95%) |
[O-E]/E % |
C.I. [O-E]/E (95%) |
| 05 |
1 |
0 |
11 |
9.1 |
100.0 |
( 0.0;100.0) |
Inf |
( -Inf; Inf) |
| 14 |
1 |
0 |
11 |
9.1 |
100.0 |
( 0.0;100.0) |
Inf |
( -Inf; Inf) |
| 15 |
166 |
71 |
485 |
34.2 |
45.4 |
( 41.2; 49.5) |
133.8 |
( 105.7;161.9) |
| 07 |
22 |
13 |
195 |
11.3 |
32.8 |
( 22.4; 43.3) |
69.2 |
( -87.8;226.2) |
| 16 |
423 |
287 |
1488 |
28.4 |
28.6 |
( 26.6; 30.6) |
47.4 |
( 37.2; 57.6) |
| 17 |
461 |
447 |
2270 |
20.3 |
20.0 |
( 18.4; 21.6) |
3.1 |
( -4.8; 11.1) |
| 19 |
307 |
317 |
1733 |
17.7 |
18.8 |
( 16.9; 20.7) |
-3.2 |
( -13.4; 7.1) |
| 04 |
559 |
584 |
3166 |
17.7 |
18.6 |
( 17.2; 19.9) |
-4.3 |
( -11.7; 3.2) |
| 06 |
188 |
198 |
1065 |
17.7 |
18.4 |
( 16.1; 20.8) |
-5.1 |
( -17.8; 7.7) |
| 08 |
34 |
37 |
179 |
19.0 |
17.8 |
( 12.4; 23.3) |
-8.1 |
( -34.5; 18.3) |
| 18 |
46 |
51 |
204 |
22.5 |
17.5 |
( 12.9; 22.1) |
-9.8 |
( -28.0; 8.4) |
| 12 |
574 |
687 |
3308 |
17.4 |
16.2 |
( 15.0; 17.5) |
-16.4 |
( -22.5;-10.4) |
| 10 |
276 |
352 |
1627 |
17.0 |
15.2 |
( 13.5; 16.9) |
-21.6 |
( -29.6;-13.6) |
| 01 |
2 |
3 |
33 |
6.1 |
12.9 |
(-13.9; 39.8) |
-33.3 |
(-328.7;262.0) |
| T |
3060 |
|
15775 |
19.4 |
|
|
|
|
Table 5.3.3.3 - Standardized Estimates:
5.3.3 Percentage of adults w most recent BP<140/90 mmHg
(Type of Diabetes = Type 1 )

|
Barplots (Adjusted Rates): 5.3.3.1 5.3.3 Percentage of adults w most recent BP<140/90 mmHg - Type of Diabetes = Type 1

|
Forest plots: 5.3.3.1 5.3.3 Percentage of adults w most recent BP<140/90 mmHg - Type of Diabetes = Type 1
| s |
O |
E |
N |
CR |
AR |
C.I. (95%) |
[O-E]/E % |
C.I. [O-E]/E (95%) |
| 15 |
1168 |
753 |
2183 |
53.5 |
55.8 |
( 53.7; 57.9) |
55.1 |
( 49.1; 61.1) |
| 13 |
2628 |
1706 |
4808 |
54.7 |
55.4 |
( 54.0; 56.8) |
54.0 |
( 50.2; 57.9) |
| 09 |
520 |
457 |
1286 |
40.4 |
40.9 |
( 38.3; 43.6) |
13.8 |
( 6.3; 21.2) |
| 17 |
18635 |
17134 |
47115 |
39.6 |
39.1 |
( 38.7; 39.5) |
8.8 |
( 7.6; 9.9) |
| 05 |
485 |
473 |
1399 |
34.7 |
36.9 |
( 34.3; 39.5) |
2.5 |
( -5.2; 10.3) |
| 06 |
5932 |
5860 |
16420 |
36.1 |
36.4 |
( 35.7; 37.1) |
1.2 |
( -0.8; 3.3) |
| 04 |
9779 |
10146 |
28116 |
34.8 |
34.7 |
( 34.1; 35.2) |
-3.6 |
( -5.2; -2.1) |
| 08 |
401 |
418 |
1162 |
34.5 |
34.5 |
( 31.7; 37.3) |
-4.1 |
(-11.7; 3.6) |
| 19 |
866 |
919 |
2629 |
32.9 |
33.9 |
( 32.0; 35.8) |
-5.8 |
(-11.1; -0.4) |
| 16 |
5440 |
5982 |
16841 |
32.3 |
32.7 |
( 32.0; 33.4) |
-9.1 |
(-11.1; -7.0) |
| 12 |
2201 |
2603 |
7199 |
30.6 |
30.4 |
( 29.3; 31.5) |
-15.4 |
(-18.5;-12.4) |
| 18 |
1722 |
2123 |
5905 |
29.2 |
29.2 |
( 27.9; 30.4) |
-18.9 |
(-22.3;-15.5) |
| 10 |
3240 |
4355 |
12127 |
26.7 |
26.8 |
( 25.9; 27.6) |
-25.6 |
(-28.0;-23.2) |
| 01 |
127 |
205 |
582 |
21.8 |
22.3 |
( 18.3; 26.2) |
-38.0 |
(-49.3;-26.8) |
| T |
53144 |
|
147772 |
36.0 |
|
|
|
|
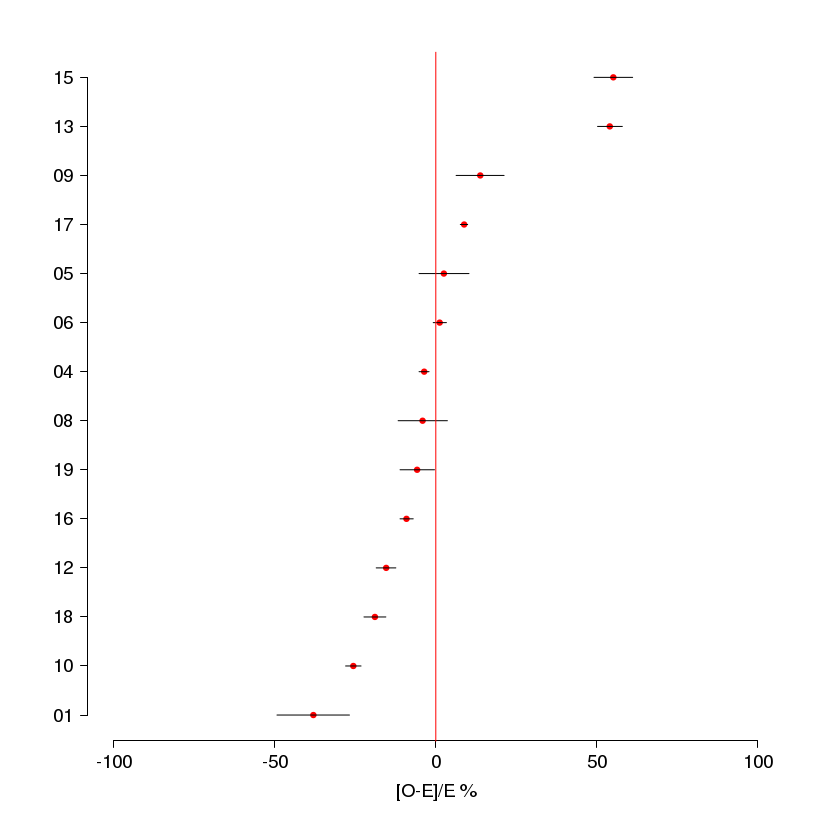
Table 5.3.3.4 - Standardized Estimates:
5.3.3 Percentage of adults w most recent BP<140/90 mmHg
(Type of Diabetes = Type 2 )

|
Barplots (Adjusted Rates): 5.3.3.2 5.3.3 Percentage of adults w most recent BP<140/90 mmHg - Type of Diabetes = Type 2
|
Forest plots: 5.3.3.2 5.3.3 Percentage of adults w most recent BP<140/90 mmHg - Type of Diabetes = Type 2
