| HbA1c |
Valid Value (%) |
NV/NA (%) |
|
| Valid Value |
163322 ( 85.3) |
0 ( 0.0) |
163322 ( 85.3) |
| NV/NA |
28121 ( 14.7) |
0 ( 0.0) |
28121 ( 14.7) |
|
191443 (100.0) |
0 ( 0.0) |
191443 (100.0) |
Table 5.3.1.1 : HbA1c (by Type of Diabetes)
| CMH Chi-Square |
p.value |
df |
| 95481.7382 |
0 |
1 |

|
Barplot 5.3.1.1 - HbA1c (by Type of Diabetes)
| HbA1c |
Type 1 (%) |
Type 2 (%) |
|
| <=9 |
13495 ( 79.7) |
132040 ( 90.2) |
145535 ( 89.1) |
| >9 |
3430 ( 20.3) |
14357 ( 9.8) |
17787 ( 10.9) |
|
16925 ( 10.4) |
146397 ( 89.6) |
163322 (100.0) |
Table 5.3.1.2 : HbA1c (by Type of Diabetes)
| CMH Chi-Square |
p.value |
df |
| 1708.9944 |
0 |
1 |

|
Barplot 5.3.1.2 - HbA1c (by Type of Diabetes)

|
Barplot 5.3.1.2a - HbA1c (by Data Source, Type of Diabetes = Type 1)

|
Barplot 5.3.1.2b - HbA1c (by Data Source, Type of Diabetes = Type 2)
| s |
O |
E |
N |
CR |
AR |
C.I. (95%) |
[O-E]/E % |
C.I. [O-E]/E (95%) |
| 05 |
11 |
2 |
13 |
84.6 |
100.0 |
( 82.6;100.0) |
450.0 |
( 262.4;637.6) |
| 18 |
6 |
3 |
27 |
22.2 |
40.5 |
( 14.4; 66.7) |
100.0 |
(-135.3;335.3) |
| 16 |
532 |
288 |
1429 |
37.2 |
37.4 |
( 35.4; 39.5) |
84.7 |
( 74.4; 95.0) |
| 17 |
689 |
450 |
2228 |
30.9 |
31.0 |
( 29.4; 32.7) |
53.1 |
( 44.9; 61.3) |
| 15 |
133 |
115 |
531 |
25.0 |
23.4 |
( 20.2; 26.7) |
15.7 |
( 0.6; 30.8) |
| 19 |
421 |
414 |
2017 |
20.9 |
20.6 |
( 18.9; 22.3) |
1.7 |
( -6.7; 10.1) |
| 14 |
8 |
8 |
26 |
30.8 |
20.3 |
( 8.6; 31.9) |
0.0 |
( -37.8; 37.8) |
| 10 |
303 |
317 |
1604 |
18.9 |
19.4 |
( 17.4; 21.3) |
-4.4 |
( -14.4; 5.6) |
| 12 |
608 |
655 |
3333 |
18.2 |
18.8 |
( 17.4; 20.2) |
-7.2 |
( -14.2; -0.1) |
| 01 |
8 |
10 |
47 |
17.0 |
16.2 |
( 5.2; 27.2) |
-20.0 |
( -71.6; 31.6) |
| 08 |
25 |
37 |
181 |
13.8 |
13.7 |
( 8.0; 19.4) |
-32.4 |
( -60.2; -4.7) |
| 04 |
496 |
769 |
3800 |
13.1 |
13.1 |
( 11.8; 14.3) |
-35.5 |
( -41.8;-29.2) |
| 11 |
9 |
15 |
51 |
17.6 |
12.2 |
( 3.7; 20.7) |
-40.0 |
( -68.9;-11.1) |
| 06 |
159 |
272 |
1341 |
11.9 |
11.8 |
( 9.7; 14.0) |
-41.5 |
( -52.1;-31.0) |
| 03 |
9 |
21 |
102 |
8.8 |
8.7 |
( 1.0; 16.4) |
-57.1 |
( -94.6;-19.6) |
| 07 |
13 |
59 |
195 |
6.7 |
4.5 |
( 0.2; 8.7) |
-78.0 |
( -92.1;-63.9) |
| T |
3430 |
|
16925 |
20.3 |
|
|
|
|
Table 5.3.1.3 - Standardized Estimates:
5.3.1 Percentage of adults w most recent HbA1c>9.0 pct
(Type of Diabetes = Type 1 )

|
Barplots (Adjusted Rates): 5.3.1.1 5.3.1 Percentage of adults w most recent HbA1c>9.0 pct - Type of Diabetes = Type 1

|
Forest plots: 5.3.1.1 5.3.1 Percentage of adults w most recent HbA1c>9.0 pct - Type of Diabetes = Type 1
| s |
O |
E |
N |
CR |
AR |
C.I. (95%) |
[O-E]/E % |
C.I. [O-E]/E (95%) |
| 05 |
375 |
119 |
1081 |
34.7 |
31.6 |
( 29.9; 33.2) |
215.1 |
( 199.9;230.3) |
| 08 |
189 |
112 |
1149 |
16.4 |
16.9 |
( 15.2; 18.6) |
68.8 |
( 50.9; 86.6) |
| 09 |
193 |
131 |
1282 |
15.1 |
14.8 |
( 13.2; 16.4) |
47.3 |
( 31.6; 63.0) |
| 16 |
1951 |
1525 |
16169 |
12.1 |
12.8 |
( 12.3; 13.3) |
27.9 |
( 22.9; 33.0) |
| 03 |
6 |
5 |
69 |
8.7 |
12.0 |
( 1.1; 22.9) |
20.0 |
(-130.3;170.3) |
| 15 |
329 |
284 |
2908 |
11.3 |
11.6 |
( 10.5; 12.7) |
15.8 |
( 4.6; 27.1) |
| 06 |
2252 |
2055 |
18446 |
12.2 |
11.0 |
( 10.6; 11.4) |
9.6 |
( 6.0; 13.2) |
| 12 |
863 |
819 |
7227 |
11.9 |
10.6 |
( 9.9; 11.2) |
5.4 |
( -0.3; 11.0) |
| 17 |
4131 |
4176 |
44829 |
9.2 |
9.9 |
( 9.6; 10.2) |
-1.1 |
( -4.2; 2.0) |
| 01 |
61 |
67 |
618 |
9.9 |
9.1 |
( 6.9; 11.4) |
-9.0 |
( -29.6; 11.7) |
| 10 |
1057 |
1206 |
11933 |
8.9 |
8.8 |
( 8.2; 9.3) |
-12.4 |
( -17.6; -7.1) |
| 04 |
2772 |
3328 |
32407 |
8.6 |
8.3 |
( 8.0; 8.7) |
-16.7 |
( -19.8;-13.6) |
| 19 |
244 |
298 |
2768 |
8.8 |
8.2 |
( 7.1; 9.3) |
-18.1 |
( -28.0; -8.2) |
| 13 |
216 |
470 |
4829 |
4.5 |
4.6 |
( 3.7; 5.5) |
-54.0 |
( -62.8;-45.2) |
| 18 |
25 |
60 |
682 |
3.7 |
4.2 |
( 1.8; 6.6) |
-58.3 |
( -85.4;-31.2) |
| T |
14664 |
|
146397 |
10.0 |
|
|
|
|
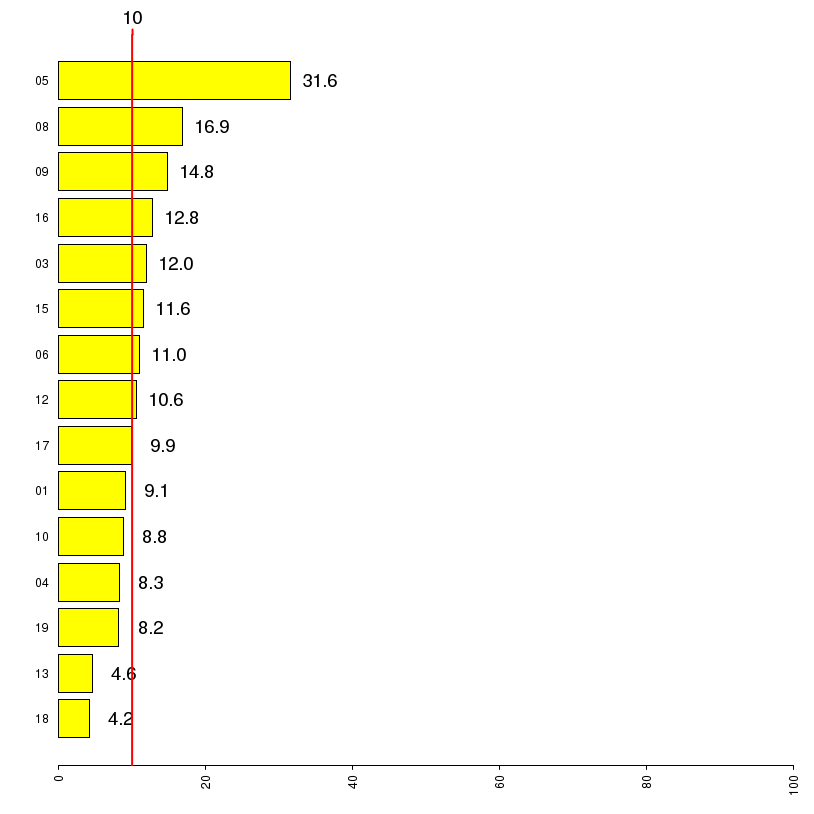
Table 5.3.1.4 - Standardized Estimates:
5.3.1 Percentage of adults w most recent HbA1c>9.0 pct
(Type of Diabetes = Type 2 )
|
Barplots (Adjusted Rates): 5.3.1.2 5.3.1 Percentage of adults w most recent HbA1c>9.0 pct - Type of Diabetes = Type 2

|
Forest plots: 5.3.1.2 5.3.1 Percentage of adults w most recent HbA1c>9.0 pct - Type of Diabetes = Type 2
