
|
| BIRO Report site: 319761ea64b939fa1be95f0c7eb6e8c07691f006 |
| Reference date: 18/02/12 |
| Parameter: 5.2.7 Percentage of adults w 1+ BP measurements in 12 mts |
| BP measurements | Valid Value (%) | NV/NA (%) | |
|---|---|---|---|
| Valid Value | 191170 (100.0) | 0 ( 0.0) | 191170 (100.0) |
| NV/NA | 0 ( 0.0) | 0 ( 0.0) | 0 ( 0.0) |
| 191170 (100.0) | 0 ( 0.0) | 191170 (100.0) |
| CMH Chi-Square |
|---|
| Too many cells have 0 obs |
|
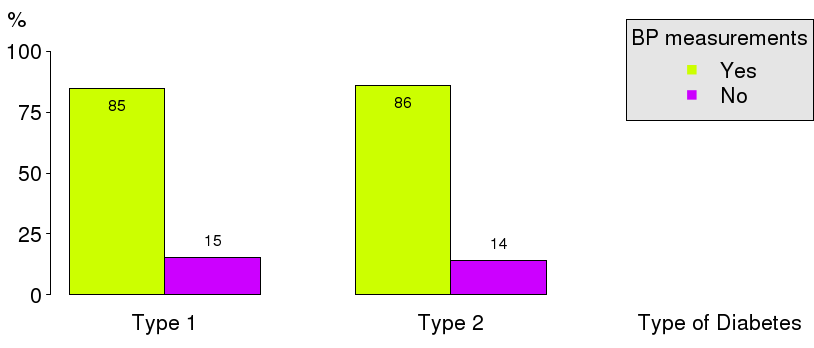
| BP measurements | Type 1 (%) | Type 2 (%) | |
|---|---|---|---|
| Yes | 15802 ( 84.6) | 147970 ( 85.8) | 163772 ( 85.7) |
| No | 2871 ( 15.4) | 24527 ( 14.2) | 27398 ( 14.3) |
| 18673 ( 9.8) | 172497 ( 90.2) | 191170 (100.0) |
| CMH Chi-Square | p.value | df |
|---|---|---|
| 18.2557 | 0 | 1 |
|
|

|
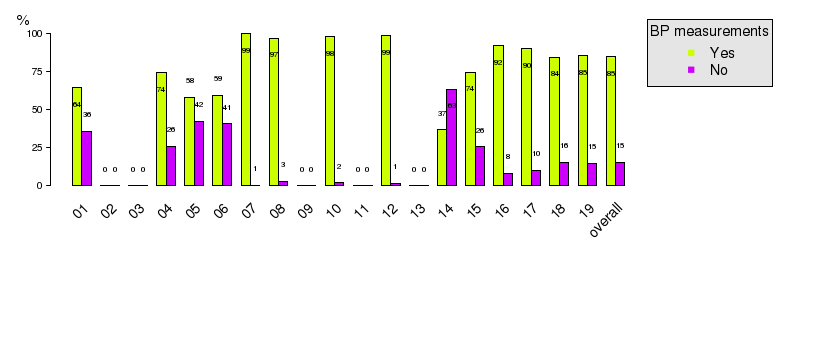
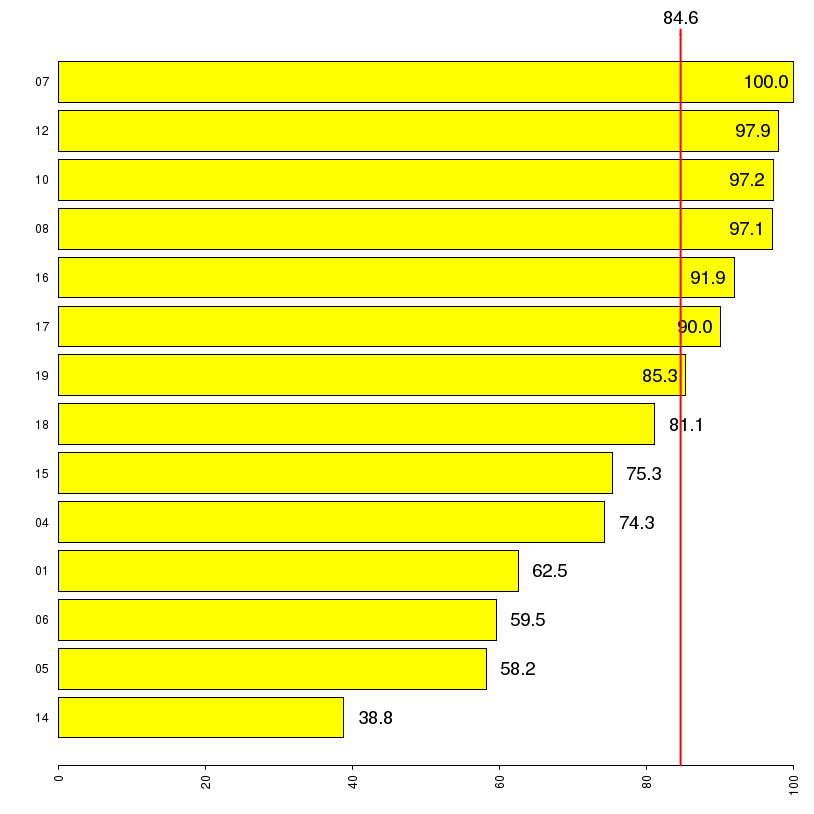
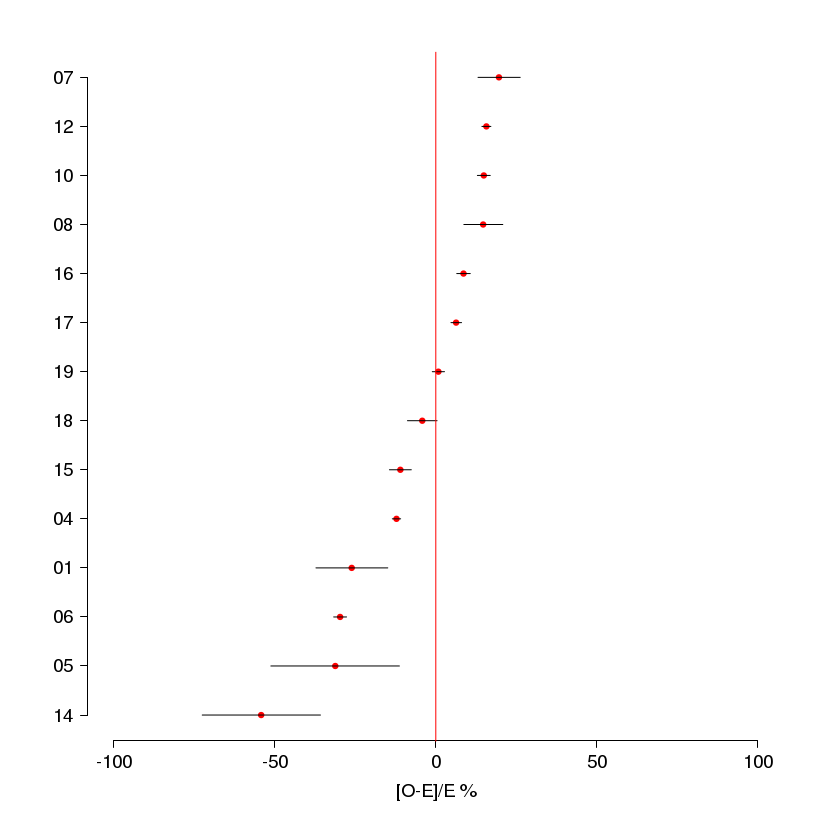
| s | O | E | N | CR | AR | C.I. (95%) | [O-E]/E % | C.I. [O-E]/E (95%) |
|---|---|---|---|---|---|---|---|---|
| 07 | 195 | 163 | 196 | 99.5 | 100.0 | ( 95.8;100.0) | 19.6 | ( 13.1; 26.2) |
| 12 | 3310 | 2860 | 3359 | 98.5 | 97.9 | ( 96.7; 99.1) | 15.7 | ( 14.3; 17.1) |
| 10 | 1628 | 1417 | 1662 | 98.0 | 97.2 | ( 95.5; 98.9) | 14.9 | ( 12.9; 16.9) |
| 08 | 179 | 156 | 185 | 96.8 | 97.1 | ( 92.0;100.0) | 14.7 | ( 8.7; 20.8) |
| 16 | 1488 | 1370 | 1619 | 91.9 | 91.9 | ( 90.2; 93.7) | 8.6 | ( 6.5; 10.7) |
| 17 | 2275 | 2140 | 2528 | 90.0 | 90.0 | ( 88.6; 91.4) | 6.3 | ( 4.7; 8.0) |
| 19 | 1742 | 1728 | 2049 | 85.0 | 85.3 | ( 83.7; 86.9) | 0.8 | ( -1.1; 2.7) |
| 18 | 205 | 214 | 243 | 84.4 | 81.1 | ( 77.0; 85.2) | -4.2 | ( -8.8; 0.4) |
| 15 | 485 | 545 | 651 | 74.5 | 75.3 | ( 72.4; 78.2) | -11.0 | (-14.4; -7.6) |
| 04 | 3174 | 3614 | 4287 | 74.0 | 74.3 | ( 73.2; 75.4) | -12.2 | (-13.5;-10.9) |
| 01 | 34 | 46 | 53 | 64.2 | 62.5 | ( 52.9; 72.2) | -26.1 | (-37.2;-14.9) |
| 06 | 1065 | 1515 | 1792 | 59.4 | 59.5 | ( 57.8; 61.2) | -29.7 | (-31.7;-27.7) |
| 05 | 11 | 16 | 19 | 57.9 | 58.2 | ( 41.4; 75.0) | -31.2 | (-51.2;-11.3) |
| 14 | 11 | 24 | 30 | 36.7 | 38.8 | ( 24.1; 53.5) | -54.2 | (-72.5;-35.8) |
| T | 15802 | 18673 | 84.6 |
|
|
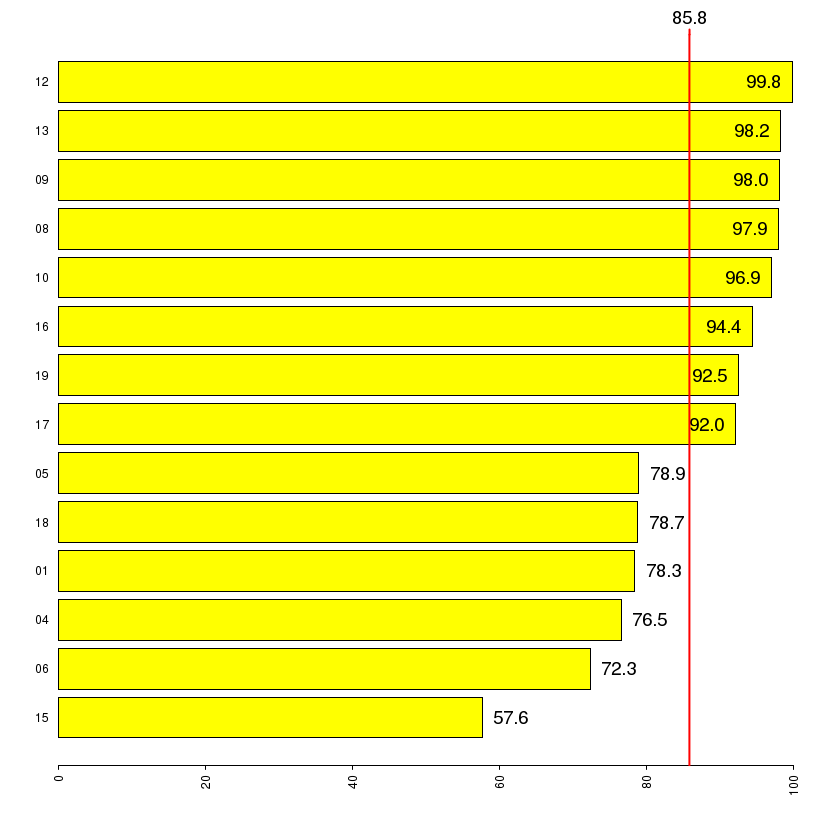
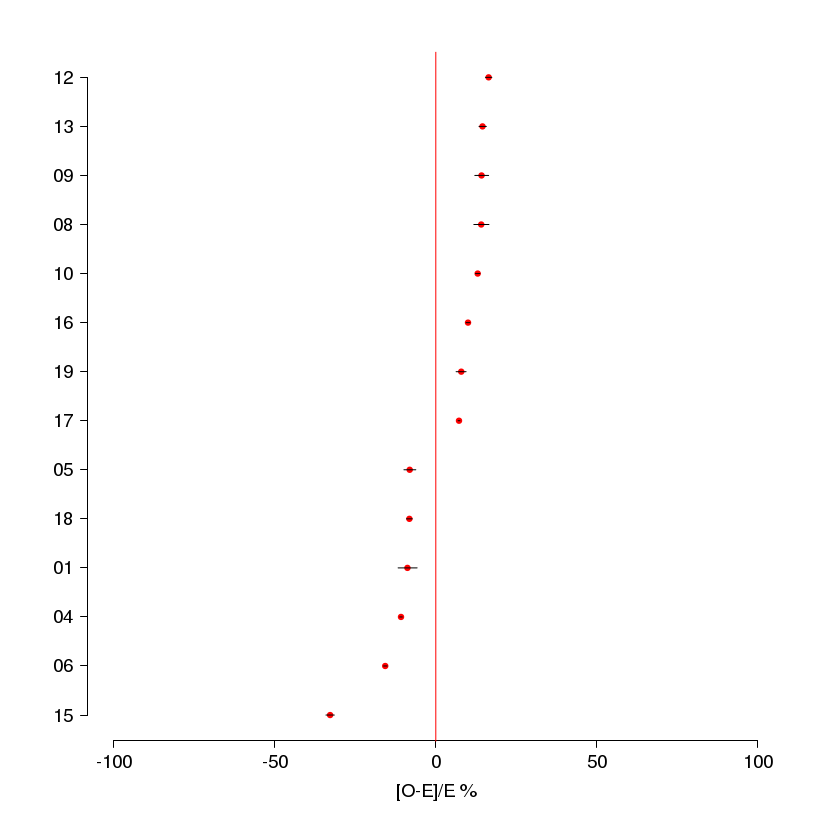
| s | O | E | N | CR | AR | C.I. (95%) | [O-E]/E % | C.I. [O-E]/E (95%) |
|---|---|---|---|---|---|---|---|---|
| 12 | 7209 | 6194 | 7304 | 98.7 | 99.8 | ( 99.0;100.0) | 16.4 | ( 15.4; 17.4) |
| 13 | 4808 | 4198 | 4884 | 98.4 | 98.2 | ( 97.3; 99.2) | 14.5 | ( 13.4; 15.7) |
| 09 | 1286 | 1126 | 1306 | 98.5 | 98.0 | ( 96.1; 99.8) | 14.2 | ( 12.1; 16.4) |
| 08 | 1162 | 1018 | 1191 | 97.6 | 97.9 | ( 95.9; 99.9) | 14.1 | ( 11.8; 16.5) |
| 10 | 12131 | 10734 | 12560 | 96.6 | 96.9 | ( 96.3; 97.6) | 13.0 | ( 12.3; 13.7) |
| 16 | 16841 | 15304 | 17831 | 94.4 | 94.4 | ( 93.9; 94.9) | 10.0 | ( 9.4; 10.6) |
| 19 | 2632 | 2440 | 2859 | 92.1 | 92.5 | ( 91.2; 93.8) | 7.9 | ( 6.3; 9.4) |
| 17 | 47213 | 44038 | 50927 | 92.7 | 92.0 | ( 91.7; 92.3) | 7.2 | ( 6.9; 7.5) |
| 05 | 1400 | 1523 | 1765 | 79.3 | 78.9 | ( 77.3; 80.5) | -8.1 | ( -9.9; -6.2) |
| 18 | 5913 | 6444 | 7475 | 79.1 | 78.7 | ( 77.9; 79.5) | -8.2 | ( -9.1; -7.3) |
| 01 | 584 | 640 | 745 | 78.4 | 78.3 | ( 75.8; 80.8) | -8.8 | (-11.7; -5.8) |
| 04 | 28178 | 31583 | 37064 | 76.0 | 76.5 | ( 76.2; 76.9) | -10.8 | (-11.2;-10.4) |
| 06 | 16426 | 19479 | 22804 | 72.0 | 72.3 | ( 71.9; 72.8) | -15.7 | (-16.2;-15.1) |
| 15 | 2187 | 3255 | 3782 | 57.8 | 57.6 | ( 56.5; 58.7) | -32.8 | (-34.1;-31.5) |
| T | 147970 | 172497 | 85.8 |
|
|
| Copyright BIRO Consortium |