
|
| BIRO Report site: 319761ea64b939fa1be95f0c7eb6e8c07691f006 |
| Reference date: 18/02/12 |
| Parameter: 5.2.6 Percentage of adults w creatinine tested in 12 mts |
| Creatinine | Valid Value (%) | NV/NA (%) | |
|---|---|---|---|
| Valid Value | 155783 (100.0) | 0 ( 0.0) | 155783 (100.0) |
| NV/NA | 0 ( 0.0) | 0 ( 0.0) | 0 ( 0.0) |
| 155783 (100.0) | 0 ( 0.0) | 155783 (100.0) |
| CMH Chi-Square |
|---|
| Too many cells have 0 obs |

|
| Creatinine | Type 1 (%) | Type 2 (%) | |
|---|---|---|---|
| Yes | 12328 ( 82.5) | 120398 ( 85.5) | 132726 ( 85.2) |
| No | 2614 ( 17.5) | 20443 ( 14.5) | 23057 ( 14.8) |
| 14942 ( 9.6) | 140841 ( 90.4) | 155783 (100.0) |
| CMH Chi-Square | p.value | df |
|---|---|---|
| 94.8562 | 0 | 1 |

|

|

|
| s | O | E | N | CR | AR | C.I. (95%) | [O-E]/E % | C.I. [O-E]/E (95%) |
|---|---|---|---|---|---|---|---|---|
| 08 | 181 | 154 | 185 | 97.8 | 97.0 | ( 91.7;100.0) | 17.5 | ( 11.2; 23.9) |
| 12 | 3234 | 2797 | 3359 | 96.3 | 95.4 | ( 94.2; 96.6) | 15.6 | ( 14.1; 17.1) |
| 18 | 236 | 211 | 243 | 97.1 | 92.3 | ( 88.2; 96.3) | 11.8 | ( 7.2; 16.5) |
| 16 | 1415 | 1331 | 1619 | 87.4 | 87.7 | ( 85.9; 89.6) | 6.3 | ( 4.1; 8.6) |
| 10 | 1456 | 1391 | 1662 | 87.6 | 86.4 | ( 84.6; 88.1) | 4.7 | ( 2.6; 6.7) |
| 14 | 22 | 22 | 30 | 73.3 | 82.5 | ( 64.6;100.0) | 0.0 | (-24.4; 24.4) |
| 19 | 1622 | 1677 | 2049 | 79.2 | 79.8 | ( 78.1; 81.5) | -3.3 | ( -5.3; -1.2) |
| 17 | 2010 | 2087 | 2528 | 79.5 | 79.5 | ( 78.0; 80.9) | -3.7 | ( -5.5; -1.9) |
| 15 | 504 | 529 | 651 | 77.4 | 78.6 | ( 75.6; 81.6) | -4.7 | ( -8.5; -1.0) |
| 01 | 38 | 43 | 53 | 71.7 | 72.9 | ( 62.2; 83.6) | -11.6 | (-24.8; 1.6) |
| 05 | 14 | 16 | 19 | 73.7 | 72.2 | ( 55.3; 89.1) | -12.5 | (-32.6; 7.6) |
| 06 | 1204 | 1475 | 1792 | 67.2 | 67.3 | ( 65.6; 69.1) | -18.4 | (-20.5;-16.2) |
| 04 | 392 | 596 | 752 | 52.1 | 54.3 | ( 51.3; 57.2) | -34.2 | (-38.0;-30.5) |
| T | 12328 | 14942 | 82.5 |

|

|
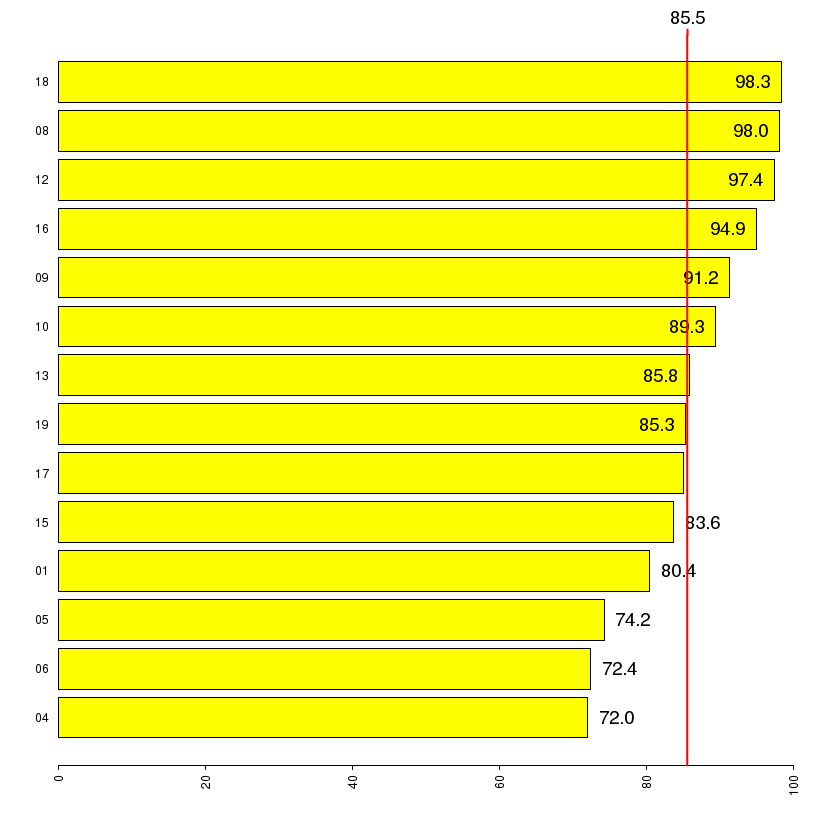
| s | O | E | N | CR | AR | C.I. (95%) | [O-E]/E % | C.I. [O-E]/E (95%) |
|---|---|---|---|---|---|---|---|---|
| 18 | 7439 | 6469 | 7475 | 99.5 | 98.3 | ( 97.5; 99.1) | 15.0 | ( 14.1; 15.9) |
| 08 | 1174 | 1024 | 1191 | 98.6 | 98.0 | ( 96.1;100.0) | 14.6 | ( 12.4; 16.9) |
| 12 | 7080 | 6211 | 7304 | 96.9 | 97.4 | ( 96.6; 98.3) | 14.0 | ( 13.0; 15.0) |
| 16 | 17007 | 15323 | 17831 | 95.4 | 94.9 | ( 94.4; 95.4) | 11.0 | ( 10.4; 11.6) |
| 09 | 1195 | 1120 | 1306 | 91.5 | 91.2 | ( 89.3; 93.1) | 6.7 | ( 4.5; 8.9) |
| 10 | 11227 | 10751 | 12560 | 89.4 | 89.3 | ( 88.7; 89.9) | 4.4 | ( 3.7; 5.1) |
| 13 | 4194 | 4181 | 4884 | 85.9 | 85.8 | ( 84.8; 86.7) | 0.3 | ( -0.8; 1.5) |
| 19 | 2428 | 2434 | 2859 | 84.9 | 85.3 | ( 84.0; 86.6) | -0.2 | ( -1.8; 1.3) |
| 17 | 43360 | 43619 | 50927 | 85.1 | 85.0 | ( 84.7; 85.3) | -0.6 | ( -0.9; -0.2) |
| 15 | 3155 | 3227 | 3782 | 83.4 | 83.6 | ( 82.5; 84.7) | -2.2 | ( -3.6; -0.9) |
| 01 | 600 | 638 | 745 | 80.5 | 80.4 | ( 77.8; 82.9) | -6.0 | ( -8.9; -3.0) |
| 05 | 1294 | 1490 | 1765 | 73.3 | 74.2 | ( 72.5; 75.9) | -13.2 | (-15.2;-11.1) |
| 06 | 16383 | 19335 | 22804 | 71.8 | 72.4 | ( 72.0; 72.9) | -15.3 | (-15.8;-14.7) |
| 04 | 3862 | 4586 | 5408 | 71.4 | 72.0 | ( 71.0; 73.0) | -15.8 | (-16.9;-14.7) |
| T | 120398 | 140841 | 85.5 |
|

|
| Copyright BIRO Consortium |