
|
| BIRO Report site: 319761ea64b939fa1be95f0c7eb6e8c07691f006 |
| Reference date: 18/02/12 |
| Parameter: 5.2.5 Percentage of adults w smoke recorded in 12 mts |
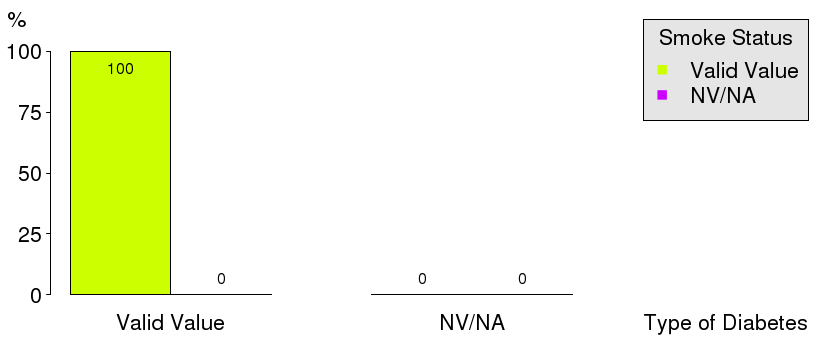
| Smoke Status | Valid Value (%) | NV/NA (%) | |
|---|---|---|---|
| Valid Value | 131514 (100.0) | 0 ( 0.0) | 131514 (100.0) |
| NV/NA | 0 ( 0.0) | 0 ( 0.0) | 0 ( 0.0) |
| 131514 (100.0) | 0 ( 0.0) | 131514 (100.0) |
| CMH Chi-Square |
|---|
| Too many cells have 0 obs |
|
| Smoke Status | Type 1 (%) | Type 2 (%) | |
|---|---|---|---|
| Documented | 10297 ( 67.0) | 76374 ( 65.8) | 86671 ( 65.9) |
| Not Documented | 5062 ( 33.0) | 39781 ( 34.2) | 44843 ( 34.1) |
| 15359 ( 11.7) | 116155 ( 88.3) | 131514 (100.0) |
| CMH Chi-Square | p.value | df |
|---|---|---|
| 9.9936 | 0.0016 | 1 |

|

|

|
| s | O | E | N | CR | AR | C.I. (95%) | [O-E]/E % | C.I. [O-E]/E (95%) |
|---|---|---|---|---|---|---|---|---|
| 14 | 30 | 20 | 30 | 100.0 | 100.0 | ( 83.4;100.0) | 50.0 | ( 24.2; 75.8) |
| 08 | 180 | 125 | 185 | 97.3 | 96.5 | ( 89.9;100.0) | 44.0 | ( 34.2; 53.8) |
| 10 | 1609 | 1139 | 1662 | 96.8 | 94.7 | ( 92.5; 96.9) | 41.3 | ( 38.1; 44.4) |
| 16 | 1488 | 1077 | 1619 | 91.9 | 92.6 | ( 90.3; 94.9) | 38.2 | ( 34.7; 41.6) |
| 12 | 3141 | 2279 | 3359 | 93.5 | 92.4 | ( 90.8; 94.0) | 37.8 | ( 35.5; 40.1) |
| 01 | 48 | 37 | 53 | 90.6 | 87.0 | ( 74.8; 99.2) | 29.7 | ( 12.2; 47.2) |
| 05 | 19 | 15 | 19 | 100.0 | 84.9 | ( 67.5;100.0) | 26.7 | ( 4.5; 48.8) |
| 06 | 1479 | 1200 | 1792 | 82.5 | 82.6 | ( 80.5; 84.8) | 23.2 | ( 20.0; 26.5) |
| 18 | 219 | 179 | 243 | 90.1 | 82.0 | ( 77.0; 87.0) | 22.3 | ( 15.5; 29.1) |
| 15 | 468 | 443 | 651 | 71.9 | 70.8 | ( 67.3; 74.3) | 5.6 | ( 0.5; 10.8) |
| 19 | 1163 | 1349 | 2049 | 56.8 | 57.8 | ( 55.7; 59.9) | -13.8 | (-16.9;-10.6) |
| 04 | 453 | 2437 | 3697 | 12.3 | 12.5 | ( 10.9; 14.0) | -81.4 | (-83.8;-79.1) |
| T | 10297 | 15359 | 67.0 |

|

|
| s | O | E | N | CR | AR | C.I. (95%) | [O-E]/E % | C.I. [O-E]/E (95%) |
|---|---|---|---|---|---|---|---|---|
| 01 | 728 | 501 | 745 | 97.7 | 97.4 | ( 94.1;100.0) | 45.3 | ( 40.4; 50.3) |
| 10 | 12038 | 8389 | 12560 | 95.8 | 96.2 | ( 95.4; 97.0) | 43.5 | ( 42.3; 44.7) |
| 12 | 6746 | 4742 | 7304 | 92.4 | 95.4 | ( 94.3; 96.5) | 42.3 | ( 40.5; 44.0) |
| 05 | 1765 | 1250 | 1765 | 100.0 | 94.7 | ( 92.7; 96.7) | 41.2 | ( 38.4; 44.0) |
| 18 | 6919 | 5143 | 7475 | 92.6 | 90.2 | ( 89.2; 91.2) | 34.5 | ( 33.0; 36.0) |
| 08 | 1062 | 792 | 1191 | 89.2 | 89.9 | ( 87.2; 92.6) | 34.1 | ( 30.1; 38.1) |
| 06 | 19825 | 15317 | 22804 | 86.9 | 86.8 | ( 86.2; 87.4) | 29.4 | ( 28.5; 30.3) |
| 09 | 1157 | 899 | 1306 | 88.6 | 86.3 | ( 83.9; 88.7) | 28.7 | ( 25.2; 32.2) |
| 16 | 15624 | 12152 | 17831 | 87.6 | 86.2 | ( 85.5; 86.9) | 28.6 | ( 27.6; 29.6) |
| 13 | 3828 | 3347 | 4884 | 78.4 | 76.7 | ( 75.4; 78.0) | 14.4 | ( 12.5; 16.2) |
| 19 | 2180 | 1938 | 2859 | 76.3 | 75.4 | ( 73.7; 77.1) | 12.5 | ( 10.0; 15.0) |
| 15 | 2209 | 2634 | 3782 | 58.4 | 56.2 | ( 54.8; 57.6) | -16.1 | (-18.2;-14.1) |
| 04 | 3801 | 20785 | 31649 | 12.0 | 12.3 | ( 11.7; 12.8) | -81.7 | (-82.5;-80.9) |
| T | 77882 | 116155 | 67.1 |

|

|
| Copyright BIRO Consortium |