| Foot examination |
Valid Value (%) |
NV/NA (%) |
|
| Valid Value |
158816 ( 84.7) |
0 ( 0.0) |
158816 ( 84.7) |
| NV/NA |
28715 ( 15.3) |
0 ( 0.0) |
28715 ( 15.3) |
|
187531 (100.0) |
0 ( 0.0) |
187531 (100.0) |
Table 5.2.4.1 : Foot examination (by Type of Diabetes)
| CMH Chi-Square |
p.value |
df |
| 90258.5183 |
0 |
1 |

|
Barplot 5.2.4.1 - Foot examination (by Type of Diabetes)
| Foot examination |
Type 1 (%) |
Type 2 (%) |
|
| Yes |
8838 ( 61.5) |
89257 ( 61.8) |
98095 ( 61.8) |
| No |
5535 ( 38.5) |
55186 ( 38.2) |
60721 ( 38.2) |
|
14373 ( 9.1) |
144443 ( 90.9) |
158816 (100.0) |
Table 5.2.4.2 : Foot examination (by Type of Diabetes)
| CMH Chi-Square |
p.value |
df |
| 0.4975 |
0.4806 |
1 |

|
Barplot 5.2.4.2 - Foot examination (by Type of Diabetes)

|
Barplot 5.2.4.2a - Foot examination (by Data Source, Type of Diabetes = Type 1)

|
Barplot 5.2.4.2b - Foot examination (by Data Source, Type of Diabetes = Type 2)
| s |
O |
E |
N |
CR |
AR |
C.I. (95%) |
[O-E]/E % |
C.I. [O-E]/E (95%) |
| 15 |
605 |
375 |
605 |
100.0 |
99.2 |
( 95.4;100.0) |
61.3 |
( 55.2; 67.5) |
| 01 |
44 |
28 |
45 |
97.8 |
96.6 |
( 82.6;100.0) |
57.1 |
( 34.6; 79.7) |
| 10 |
1312 |
891 |
1413 |
92.9 |
90.5 |
( 88.1; 93.0) |
47.3 |
( 43.4; 51.1) |
| 12 |
3013 |
2099 |
3359 |
89.7 |
88.3 |
( 86.7; 89.9) |
43.5 |
( 41.0; 46.1) |
| 14 |
24 |
17 |
30 |
80.0 |
86.8 |
( 67.5;100.0) |
41.2 |
( 7.1; 75.3) |
| 06 |
168 |
124 |
196 |
85.7 |
83.3 |
( 76.9; 89.8) |
35.5 |
( 25.3; 45.7) |
| 08 |
143 |
107 |
170 |
84.1 |
82.2 |
( 75.1; 89.2) |
33.6 |
( 22.5; 44.8) |
| 17 |
1879 |
1565 |
2528 |
74.3 |
73.8 |
( 72.0; 75.7) |
20.1 |
( 17.1; 23.1) |
| 18 |
174 |
164 |
236 |
73.7 |
65.2 |
( 60.1; 70.4) |
6.1 |
( -1.3; 13.5) |
| 16 |
916 |
982 |
1619 |
56.6 |
57.4 |
( 55.0; 59.7) |
-6.7 |
(-10.7; -2.8) |
| 19 |
80 |
118 |
189 |
42.3 |
41.7 |
( 34.9; 48.5) |
-32.2 |
(-43.1;-21.3) |
| 04 |
480 |
2376 |
3983 |
12.1 |
12.4 |
( 10.9; 14.0) |
-79.8 |
(-82.4;-77.2) |
| T |
8838 |
|
14373 |
61.5 |
|
|
|
|
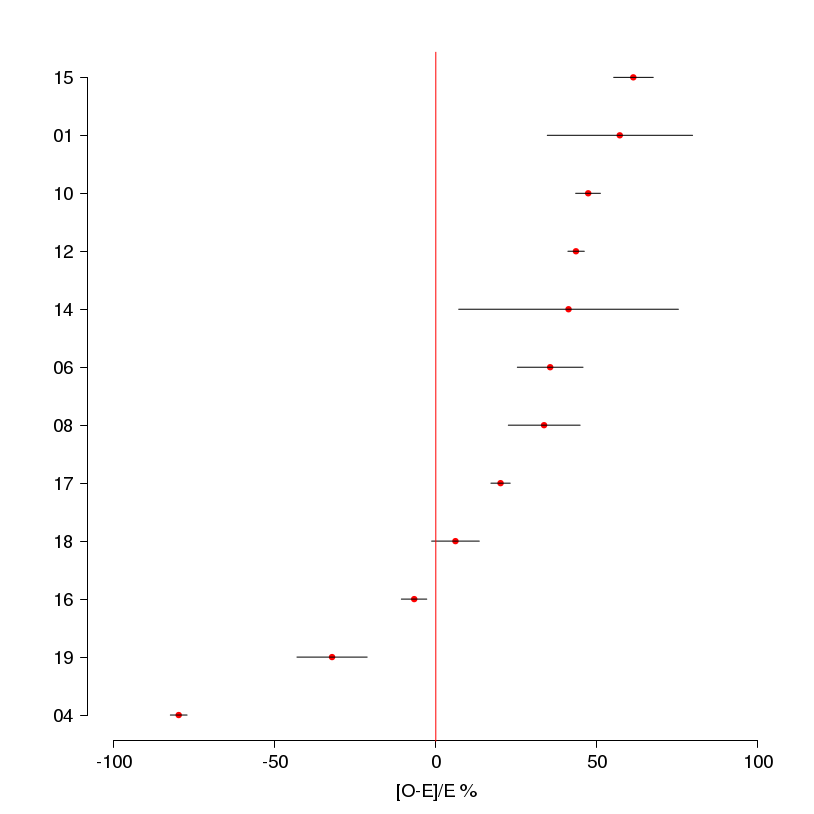
Table 5.2.4.3 - Standardized Estimates:
5.2.4 Percentage of adults w 1+ foot exam in 12 mts
(Type of Diabetes = Type 1 )

|
Barplots (Adjusted Rates): 5.2.4.1 5.2.4 Percentage of adults w 1+ foot exam in 12 mts - Type of Diabetes = Type 1
|
Forest plots: 5.2.4.1 5.2.4 Percentage of adults w 1+ foot exam in 12 mts - Type of Diabetes = Type 1
| s |
O |
E |
N |
CR |
AR |
C.I. (95%) |
[O-E]/E % |
C.I. [O-E]/E (95%) |
| 13 |
4884 |
3111 |
4884 |
100.0 |
99.5 |
( 98.2;100.0) |
57.0 |
( 54.9; 59.1) |
| 09 |
1306 |
838 |
1306 |
100.0 |
98.8 |
( 96.2;100.0) |
55.8 |
( 51.8; 59.8) |
| 15 |
2900 |
1863 |
2900 |
100.0 |
98.7 |
( 97.0;100.0) |
55.7 |
( 53.0; 58.3) |
| 01 |
689 |
448 |
707 |
97.5 |
97.5 |
( 94.0;100.0) |
53.8 |
( 48.2; 59.4) |
| 10 |
9925 |
6665 |
10616 |
93.5 |
94.4 |
( 93.5; 95.3) |
48.9 |
( 47.4; 50.4) |
| 12 |
6415 |
4507 |
7304 |
87.8 |
90.2 |
( 89.1; 91.4) |
42.3 |
( 40.5; 44.2) |
| 06 |
2905 |
2156 |
3389 |
85.7 |
85.4 |
( 83.8; 87.0) |
34.7 |
( 32.2; 37.3) |
| 16 |
12657 |
11303 |
17831 |
71.0 |
71.0 |
( 70.3; 71.7) |
12.0 |
( 10.9; 13.1) |
| 18 |
5246 |
4738 |
7422 |
70.7 |
70.2 |
( 69.1; 71.3) |
10.7 |
( 9.0; 12.4) |
| 17 |
35571 |
32867 |
50927 |
69.8 |
68.6 |
( 68.2; 69.0) |
8.2 |
( 7.6; 8.9) |
| 08 |
664 |
696 |
1112 |
59.7 |
60.5 |
( 57.6; 63.4) |
-4.6 |
( -9.2; 0.0) |
| 19 |
190 |
211 |
336 |
56.5 |
57.1 |
( 51.9; 62.3) |
-10.0 |
(-18.2; -1.7) |
| 04 |
8233 |
22178 |
35709 |
23.1 |
23.5 |
( 23.0; 24.0) |
-62.9 |
(-63.7;-62.1) |
| T |
91585 |
|
144443 |
63.4 |
|
|
|
|
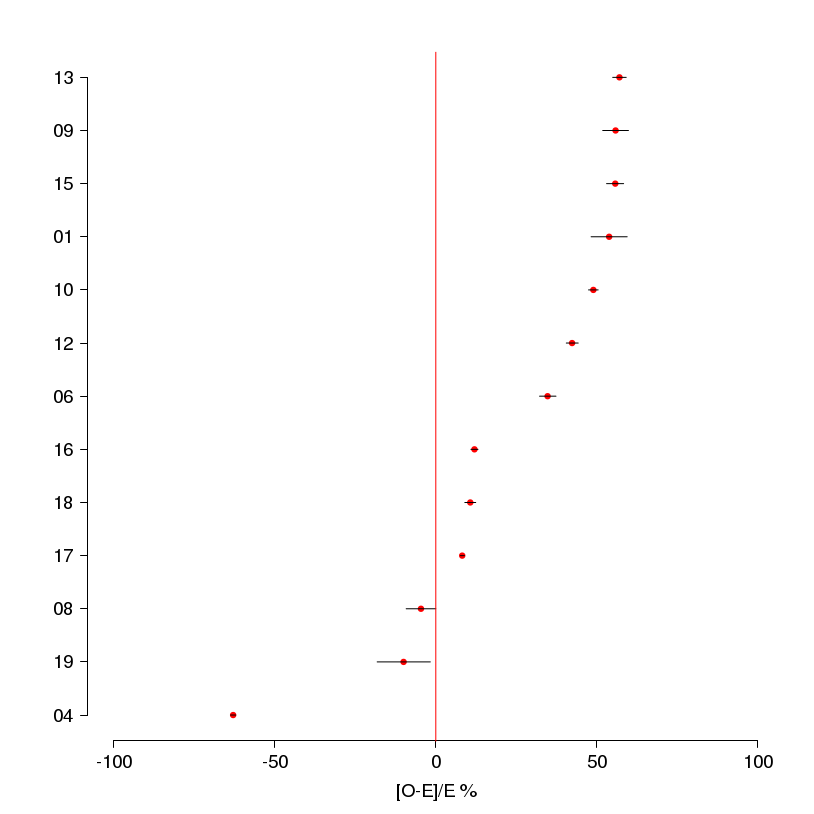
Table 5.2.4.4 - Standardized Estimates:
5.2.4 Percentage of adults w 1+ foot exam in 12 mts
(Type of Diabetes = Type 2 )

|
Barplots (Adjusted Rates): 5.2.4.2 5.2.4 Percentage of adults w 1+ foot exam in 12 mts - Type of Diabetes = Type 2
|
Forest plots: 5.2.4.2 5.2.4 Percentage of adults w 1+ foot exam in 12 mts - Type of Diabetes = Type 2
