| Microalbumin done |
Valid Value (%) |
NV/NA (%) |
|
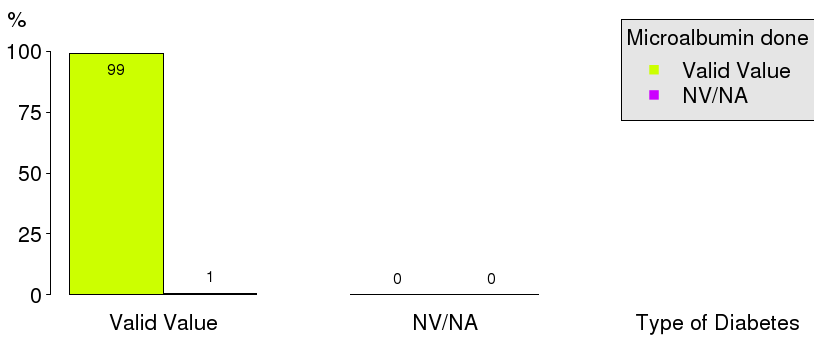
| Valid Value |
87104 ( 99.3) |
0 ( 0.0) |
87104 ( 99.3) |
| NV/NA |
636 ( 0.7) |
0 ( 0.0) |
636 ( 0.7) |
|
87740 (100.0) |
0 ( 0.0) |
87740 (100.0) |
Table 5.2.2.1 : Microalbumin done (by Type of Diabetes)
| CMH Chi-Square |
p.value |
df |
| 85214.4407 |
0 |
1 |
|
Barplot 5.2.2.1 - Microalbumin done (by Type of Diabetes)
| Microalbumin done |
Type 1 (%) |
Type 2 (%) |
|
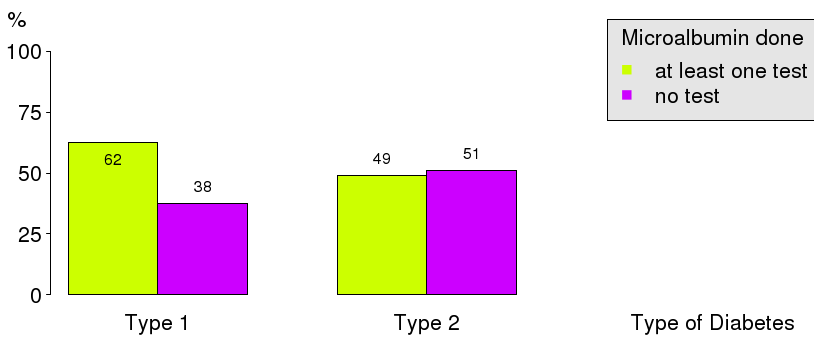
| at least one test |
8049 ( 62.4) |
36273 ( 48.9) |
44322 ( 50.9) |
| no test |
4858 ( 37.6) |
37924 ( 51.1) |
42782 ( 49.1) |
|
12907 ( 14.8) |
74197 ( 85.2) |
87104 (100.0) |
Table 5.2.2.2 : Microalbumin done (by Type of Diabetes)
| CMH Chi-Square |
p.value |
df |
| 798.1323 |
0 |
1 |
|
Barplot 5.2.2.2 - Microalbumin done (by Type of Diabetes)
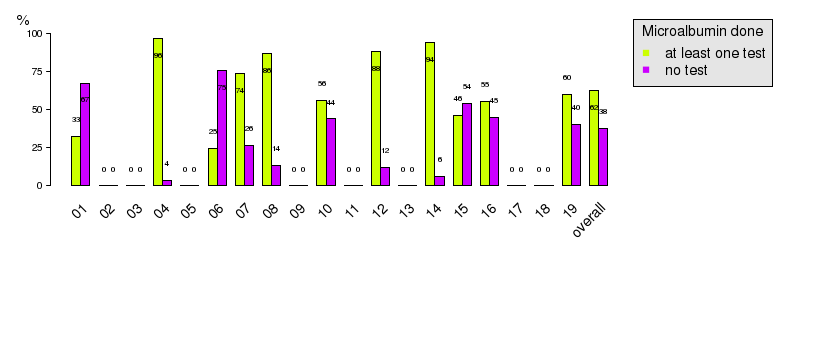
|
Barplot 5.2.2.2a - Microalbumin done (by Data Source, Type of Diabetes = Type 1)

|
Barplot 5.2.2.2b - Microalbumin done (by Data Source, Type of Diabetes = Type 2)
| s |
O |
E |
N |
CR |
AR |
C.I. (95%) |
[O-E]/E % |
C.I. [O-E]/E (95%) |
| 14 |
407 |
241 |
434 |
93.8 |
100.0 |
( 99.1;100.0) |
68.9 |
( 59.5; 78.2) |
| 12 |
2841 |
2034 |
3233 |
87.9 |
86.2 |
( 84.6; 87.9) |
39.7 |
( 37.1; 42.3) |
| 08 |
160 |
118 |
185 |
86.5 |
83.7 |
( 77.0; 90.4) |
35.6 |
( 25.1; 46.1) |
| 07 |
324 |
254 |
440 |
73.6 |
78.8 |
( 73.8; 83.7) |
27.6 |
( 19.0; 36.1) |
| 19 |
1216 |
1270 |
2033 |
59.8 |
59.1 |
( 57.0; 61.2) |
-4.3 |
( -7.6; -0.9) |
| 10 |
1011 |
1127 |
1800 |
56.2 |
55.4 |
( 53.2; 57.6) |
-10.3 |
(-13.8; -6.8) |
| 16 |
996 |
1118 |
1803 |
55.2 |
55.0 |
( 52.8; 57.2) |
-10.9 |
(-14.5; -7.3) |
| 15 |
404 |
511 |
879 |
46.0 |
48.8 |
( 45.4; 52.3) |
-20.9 |
(-26.9;-15.0) |
| 01 |
16 |
32 |
49 |
32.7 |
30.9 |
( 18.1; 43.7) |
-50.0 |
(-69.6;-30.4) |
| 06 |
450 |
1122 |
1818 |
24.8 |
24.8 |
( 22.5; 27.0) |
-59.9 |
(-63.5;-56.3) |
| T |
7825 |
|
12674 |
61.7 |
|
|
|
|
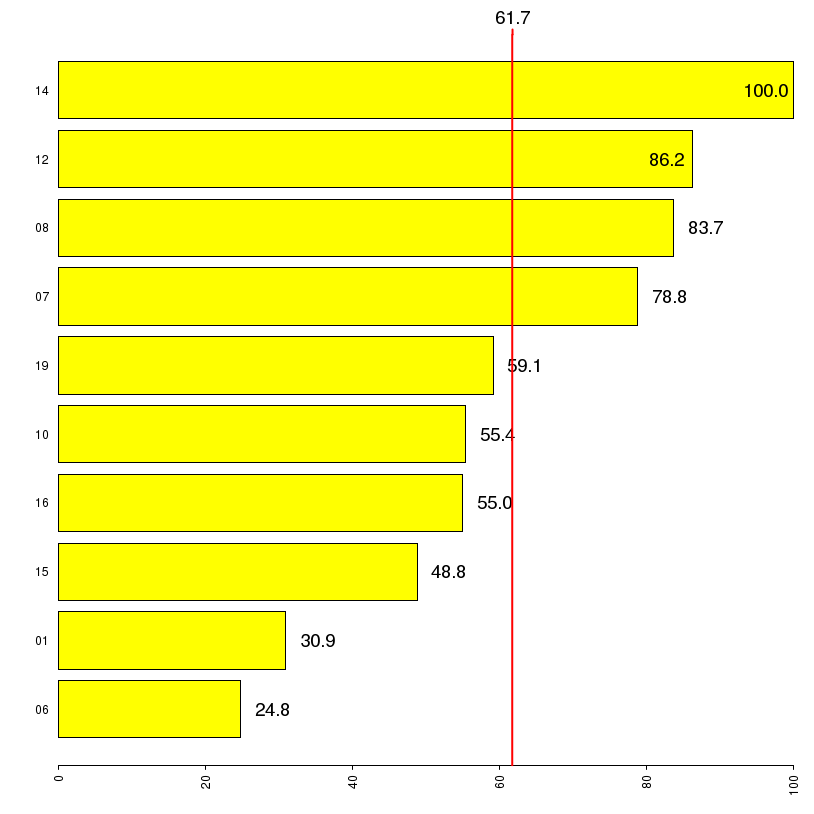
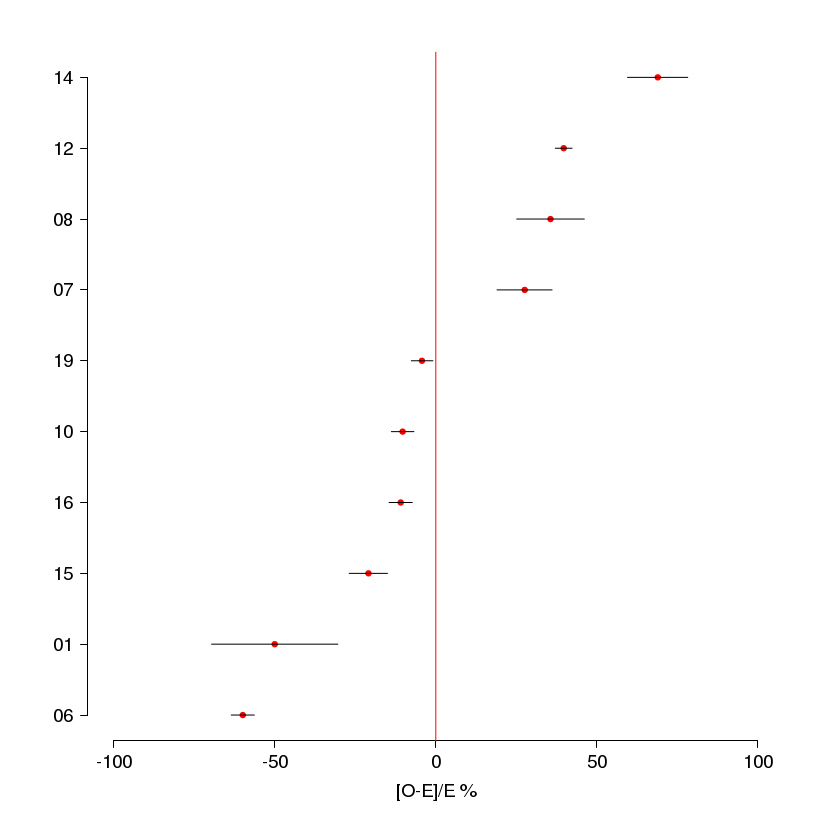
Table 5.2.2.3 - Standardized Estimates:
5.2.2 Percentage of adults w 1+ microalbumin tests in 12 mts
(Type of Diabetes = Type 1 )
|
Barplots (Adjusted Rates): 5.2.2.1 5.2.2 Percentage of adults w 1+ microalbumin tests in 12 mts - Type of Diabetes = Type 1
|
Forest plots: 5.2.2.1 5.2.2 Percentage of adults w 1+ microalbumin tests in 12 mts - Type of Diabetes = Type 1
| s |
O |
E |
N |
CR |
AR |
C.I. (95%) |
[O-E]/E % |
C.I. [O-E]/E (95%) |
| 12 |
5762 |
3368 |
6926 |
83.2 |
82.9 |
( 81.8; 84.1) |
71.1 |
( 68.7; 73.5) |
| 16 |
12337 |
8729 |
17832 |
69.2 |
68.5 |
( 67.8; 69.2) |
41.3 |
( 39.9; 42.8) |
| 08 |
744 |
585 |
1191 |
62.5 |
61.6 |
( 58.9; 64.4) |
27.2 |
( 21.5; 32.9) |
| 10 |
7213 |
6143 |
12569 |
57.4 |
56.9 |
( 56.0; 57.8) |
17.4 |
( 15.6; 19.2) |
| 19 |
1452 |
1367 |
2835 |
51.2 |
51.5 |
( 49.6; 53.3) |
6.2 |
( 2.4; 10.0) |
| 14 |
2 |
2 |
2 |
100.0 |
48.5 |
( 19.4; 77.6) |
0.0 |
(-29.1; 29.1) |
| 01 |
305 |
332 |
691 |
44.1 |
44.5 |
( 40.8; 48.3) |
-8.1 |
(-15.9; -0.3) |
| 15 |
1631 |
1815 |
3782 |
43.1 |
43.6 |
( 42.0; 45.2) |
-10.1 |
(-13.5; -6.8) |
| 13 |
2092 |
2370 |
4884 |
42.8 |
42.8 |
( 41.4; 44.2) |
-11.7 |
(-14.6; -8.9) |
| 06 |
4099 |
10925 |
22810 |
18.0 |
18.2 |
( 17.5; 18.8) |
-62.5 |
(-63.8;-61.1) |
| T |
35637 |
|
73522 |
48.5 |
|
|
|
|
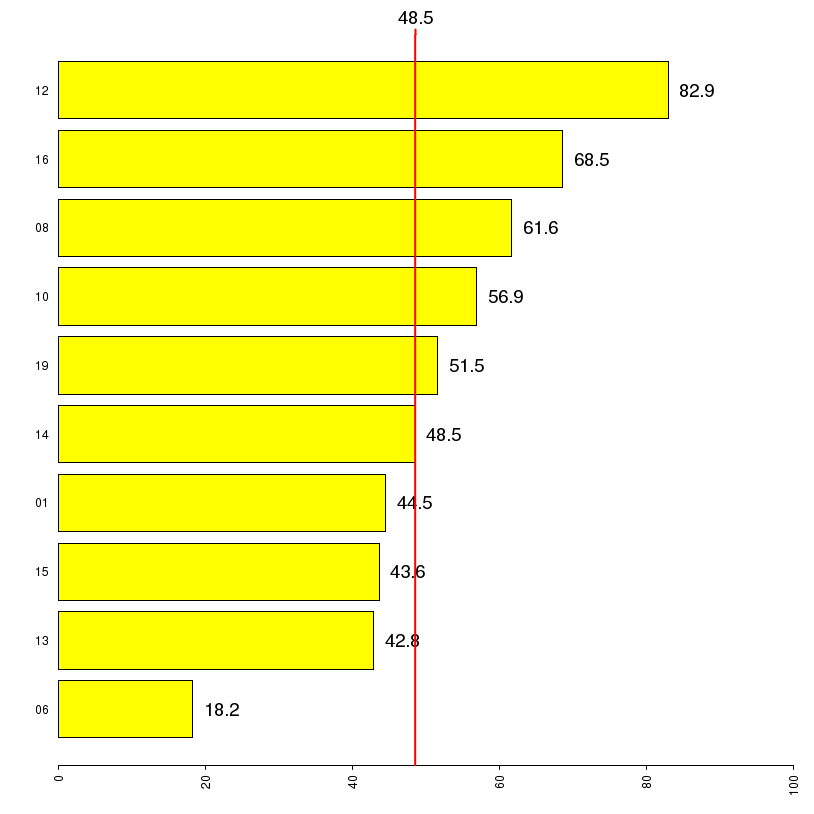
Table 5.2.2.4 - Standardized Estimates:
5.2.2 Percentage of adults w 1+ microalbumin tests in 12 mts
(Type of Diabetes = Type 2 )
|
Barplots (Adjusted Rates): 5.2.2.2 5.2.2 Percentage of adults w 1+ microalbumin tests in 12 mts - Type of Diabetes = Type 2

|
Forest plots: 5.2.2.2 5.2.2 Percentage of adults w 1+ microalbumin tests in 12 mts - Type of Diabetes = Type 2
