| Lipid lowering treatment |
Valid Value (%) |
NV/NA (%) |
|
| Valid Value |
133525 ( 83.4) |
0 ( 0.0) |
133525 ( 83.4) |
| NV/NA |
26529 ( 16.6) |
0 ( 0.0) |
26529 ( 16.6) |
|
160054 (100.0) |
0 ( 0.0) |
160054 (100.0) |
Table 5.2.14.1 : Lipid lowering treatment (by Type of Diabetes)
| CMH Chi-Square |
p.value |
df |
| 71526.7598 |
0 |
1 |

|
Barplot 5.2.14.1 - Lipid lowering treatment (by Type of Diabetes)
| Lipid lowering treatment |
Type 1 (%) |
Type 2 (%) |
|
| Yes |
3300 ( 26.6) |
57668 ( 47.6) |
60968 ( 45.7) |
| No |
9129 ( 73.4) |
63428 ( 52.4) |
72557 ( 54.3) |
|
12429 ( 9.3) |
121096 ( 90.7) |
133525 (100.0) |
Table 5.2.14.2 : Lipid lowering treatment (by Type of Diabetes)
| CMH Chi-Square |
p.value |
df |
| 2016.1886 |
0 |
1 |

|
Barplot 5.2.14.2 - Lipid lowering treatment (by Type of Diabetes)

|
Barplot 5.2.14.2a - Lipid lowering treatment (by Data Source, Type of Diabetes = Type 1)

|
Barplot 5.2.14.2b - Lipid lowering treatment (by Data Source, Type of Diabetes = Type 2)
| s |
O |
E |
N |
CR |
AR |
C.I. (95%) |
[O-E]/E % |
C.I. [O-E]/E (95%) |
| 01 |
12 |
4 |
29 |
41.4 |
79.7 |
( 52.5;100.0) |
200.0 |
( 3.5;396.5) |
| 08 |
74 |
53 |
183 |
40.4 |
37.1 |
( 31.5; 42.6) |
39.6 |
( 20.4; 58.8) |
| 12 |
1194 |
943 |
3317 |
36.0 |
33.6 |
( 32.3; 34.9) |
26.6 |
( 21.9; 31.3) |
| 18 |
106 |
90 |
236 |
44.9 |
31.3 |
( 27.1; 35.4) |
17.8 |
( 6.9; 28.7) |
| 19 |
341 |
296 |
1157 |
29.5 |
30.6 |
( 28.2; 33.0) |
15.2 |
( 5.8; 24.6) |
| 06 |
50 |
48 |
214 |
23.4 |
27.7 |
( 21.3; 34.0) |
4.2 |
(-24.1; 32.4) |
| 17 |
570 |
659 |
2528 |
22.5 |
23.0 |
( 21.4; 24.6) |
-13.5 |
(-19.7; -7.4) |
| 10 |
232 |
286 |
967 |
24.0 |
21.5 |
( 19.2; 23.9) |
-18.9 |
(-26.9;-10.8) |
| 04 |
721 |
913 |
3768 |
19.1 |
21.0 |
( 19.6; 22.3) |
-21.0 |
(-26.7;-15.3) |
| T |
3300 |
|
12399 |
26.6 |
|
|
|
|
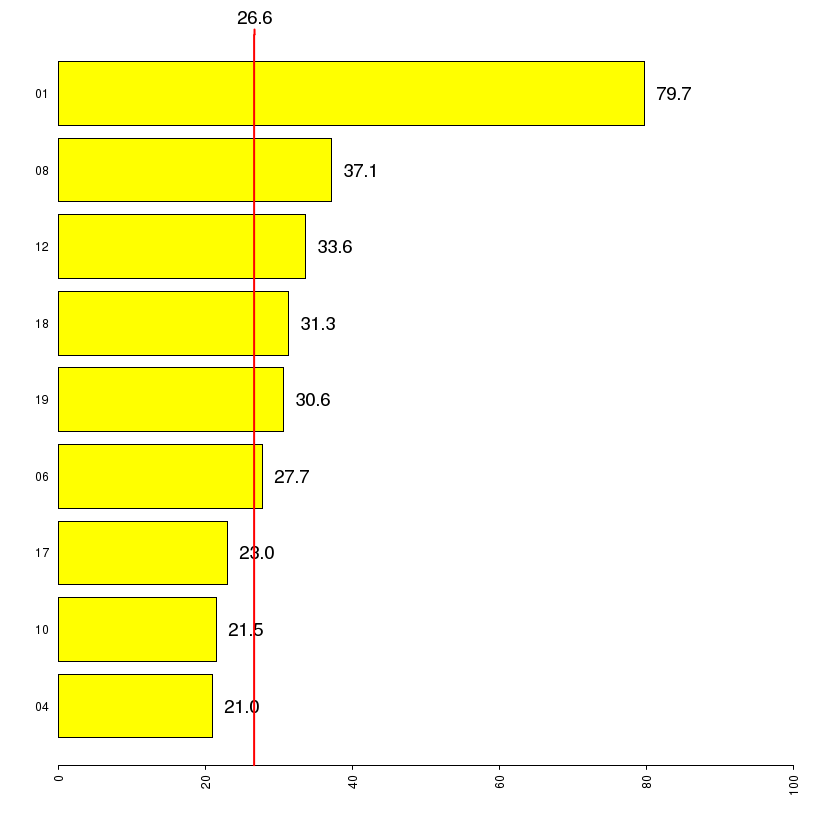
Table 5.2.14.3 - Standardized Estimates:
5.2.14 Percentage of adults w lipid lowering treatment
(Type of Diabetes = Type 1 )
|
Barplots (Adjusted Rates): 5.2.14.1 5.2.14 Percentage of adults w lipid lowering treatment - Type of Diabetes = Type 1

|
Forest plots: 5.2.14.1 5.2.14 Percentage of adults w lipid lowering treatment - Type of Diabetes = Type 1
| s |
O |
E |
N |
CR |
AR |
C.I. (95%) |
[O-E]/E % |
C.I. [O-E]/E (95%) |
| 01 |
341 |
227 |
469 |
72.7 |
71.5 |
( 67.1; 76.0) |
50.2 |
( 41.1; 59.4) |
| 13 |
3396 |
2307 |
4884 |
69.5 |
70.1 |
( 68.7; 71.5) |
47.2 |
( 44.2; 50.2) |
| 19 |
1670 |
1151 |
2457 |
68.0 |
69.1 |
( 67.1; 71.1) |
45.1 |
( 40.8; 49.3) |
| 12 |
5028 |
3527 |
7176 |
70.1 |
67.9 |
( 66.8; 69.0) |
42.6 |
( 40.3; 44.8) |
| 18 |
3776 |
3466 |
7422 |
50.9 |
51.9 |
( 50.7; 53.0) |
8.9 |
( 6.5; 11.4) |
| 06 |
2646 |
2463 |
5016 |
52.8 |
51.2 |
( 49.8; 52.5) |
7.4 |
( 4.7; 10.1) |
| 08 |
564 |
535 |
1142 |
49.4 |
50.2 |
( 47.3; 53.1) |
5.4 |
( -0.8; 11.6) |
| 10 |
3881 |
3768 |
7967 |
48.7 |
49.0 |
( 48.0; 50.1) |
3.0 |
( 0.7; 5.3) |
| 09 |
614 |
624 |
1306 |
47.0 |
46.9 |
( 44.2; 49.5) |
-1.6 |
( -7.2; 4.0) |
| 17 |
21790 |
23831 |
50927 |
42.8 |
43.5 |
( 43.1; 44.0) |
-8.6 |
( -9.5; -7.6) |
| 04 |
13962 |
15764 |
32330 |
43.2 |
42.2 |
( 41.6; 42.7) |
-11.4 |
(-12.5;-10.3) |
| T |
57668 |
|
121096 |
47.6 |
|
|
|
|
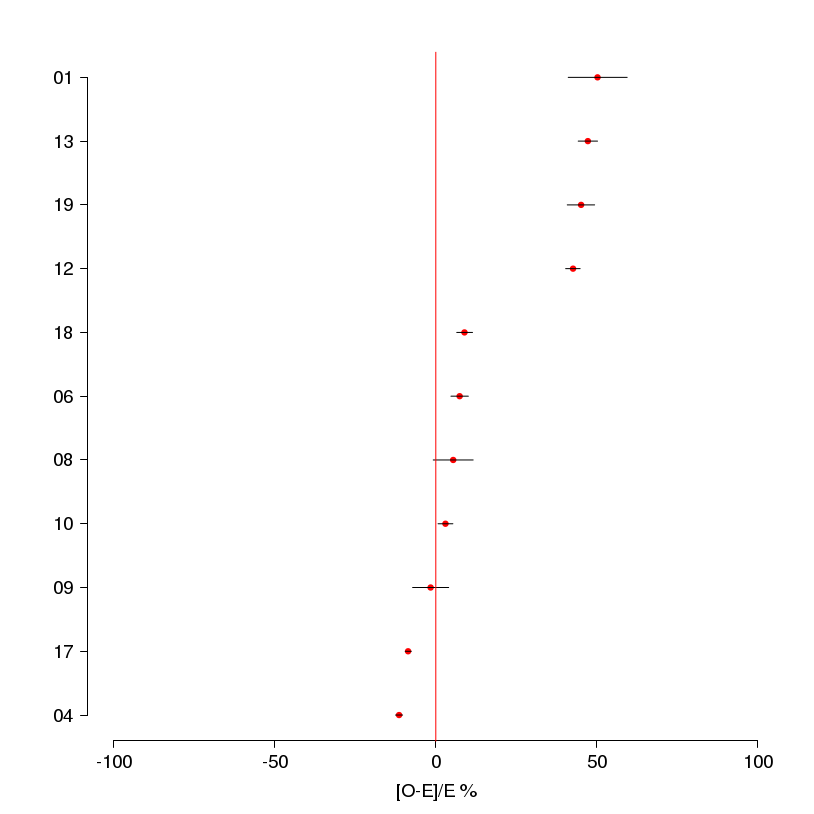
Table 5.2.14.4 - Standardized Estimates:
5.2.14 Percentage of adults w lipid lowering treatment
(Type of Diabetes = Type 2 )

|
Barplots (Adjusted Rates): 5.2.14.2 5.2.14 Percentage of adults w lipid lowering treatment - Type of Diabetes = Type 2
|
Forest plots: 5.2.14.2 5.2.14 Percentage of adults w lipid lowering treatment - Type of Diabetes = Type 2
