| Antihypertensive |
Valid Value (%) |
NV/NA (%) |
|
| Valid Value |
90251 ( 79.1) |
0 ( 0.0) |
90251 ( 79.1) |
| NV/NA |
23829 ( 20.9) |
0 ( 0.0) |
23829 ( 20.9) |
|
114080 (100.0) |
0 ( 0.0) |
114080 (100.0) |
Table 5.2.13.1 : Antihypertensive (by Type of Diabetes)
| CMH Chi-Square |
p.value |
df |
| 38673.5807 |
0 |
1 |

|
Barplot 5.2.13.1 - Antihypertensive (by Type of Diabetes)
| Antihypertensive |
Type 1 (%) |
Type 2 (%) |
|
| Treated |
2584 ( 32.3) |
56179 ( 68.3) |
58763 ( 65.1) |
| Not Treated |
5419 ( 67.7) |
26069 ( 31.7) |
31488 ( 34.9) |
|
8003 ( 8.9) |
82248 ( 91.1) |
90251 (100.0) |
Table 5.2.13.2 : Antihypertensive (by Type of Diabetes)
| CMH Chi-Square |
p.value |
df |
| 4163.1199 |
0 |
1 |

|
Barplot 5.2.13.2 - Antihypertensive (by Type of Diabetes)

|
Barplot 5.2.13.2a - Antihypertensive (by Data Source, Type of Diabetes = Type 1)

|
Barplot 5.2.13.2b - Antihypertensive (by Data Source, Type of Diabetes = Type 2)
| s |
O |
E |
N |
CR |
AR |
C.I. (95%) |
[O-E]/E % |
C.I. [O-E]/E (95%) |
| 14 |
8 |
1 |
30 |
26.7 |
100.0 |
(191.0;100.0) |
700.0 |
(-1317.6;2717.6) |
| 01 |
17 |
9 |
41 |
41.5 |
61.0 |
( 43.5; 78.4) |
88.9 |
( 9.4; 168.4) |
| 18 |
160 |
110 |
242 |
66.1 |
47.0 |
( 42.8; 51.1) |
45.5 |
( 36.3; 54.6) |
| 06 |
161 |
119 |
359 |
44.8 |
43.7 |
( 39.5; 47.9) |
35.3 |
( 22.6; 48.0) |
| 16 |
643 |
521 |
1619 |
39.7 |
39.8 |
( 37.8; 41.8) |
23.4 |
( 17.2; 29.6) |
| 08 |
79 |
70 |
183 |
43.2 |
36.4 |
( 31.3; 41.6) |
12.9 |
( -0.6; 26.3) |
| 19 |
270 |
254 |
783 |
34.5 |
34.3 |
( 31.5; 37.2) |
6.3 |
( -2.5; 15.1) |
| 10 |
361 |
357 |
978 |
36.9 |
32.6 |
( 30.3; 35.0) |
1.1 |
( -5.3; 7.5) |
| 04 |
885 |
1141 |
3768 |
23.5 |
25.0 |
( 23.7; 26.4) |
-22.4 |
( -27.0; -17.9) |
| T |
2584 |
|
8003 |
32.3 |
|
|
|
|
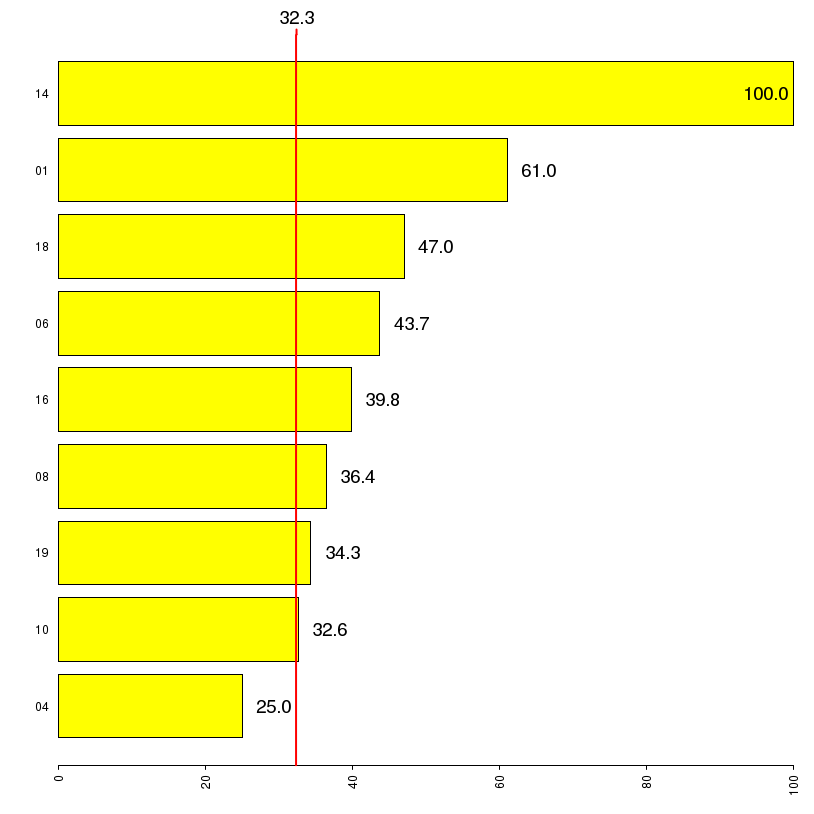
Table 5.2.13.3 - Standardized Estimates:
5.2.13 Percentage of adults w antihypertensive treatment
(Type of Diabetes = Type 1 )
|
Barplots (Adjusted Rates): 5.2.13.1 5.2.13 Percentage of adults w antihypertensive treatment - Type of Diabetes = Type 1

|
Forest plots: 5.2.13.1 5.2.13 Percentage of adults w antihypertensive treatment - Type of Diabetes = Type 1
| s |
O |
E |
N |
CR |
AR |
C.I. (95%) |
[O-E]/E % |
C.I. [O-E]/E (95%) |
| 18 |
6250 |
5152 |
7475 |
83.6 |
82.9 |
( 81.8; 83.9) |
21.3 |
( 19.8; 22.8) |
| 08 |
943 |
787 |
1139 |
82.8 |
81.8 |
( 79.2; 84.4) |
19.8 |
( 16.1; 23.6) |
| 01 |
512 |
437 |
646 |
79.3 |
80.0 |
( 76.5; 83.6) |
17.2 |
( 11.9; 22.5) |
| 06 |
5677 |
4897 |
7313 |
77.6 |
79.2 |
( 78.1; 80.3) |
15.9 |
( 14.3; 17.5) |
| 10 |
6352 |
5644 |
8219 |
77.3 |
76.9 |
( 75.9; 77.8) |
12.5 |
( 11.1; 14.0) |
| 19 |
1782 |
1607 |
2411 |
73.9 |
75.7 |
( 73.9; 77.6) |
10.9 |
( 8.1; 13.7) |
| 13 |
3493 |
3275 |
4884 |
71.5 |
72.9 |
( 71.5; 74.2) |
6.7 |
( 4.7; 8.6) |
| 16 |
11322 |
12017 |
17831 |
63.5 |
64.4 |
( 63.7; 65.0) |
-5.8 |
( -6.8; -4.8) |
| 04 |
19848 |
22363 |
32330 |
61.4 |
60.6 |
( 60.1; 61.1) |
-11.2 |
(-12.0;-10.5) |
| T |
56179 |
|
82248 |
68.3 |
|
|
|
|
Table 5.2.13.4 - Standardized Estimates:
5.2.13 Percentage of adults w antihypertensive treatment
(Type of Diabetes = Type 2 )

|
Barplots (Adjusted Rates): 5.2.13.2 5.2.13 Percentage of adults w antihypertensive treatment - Type of Diabetes = Type 2

|
Forest plots: 5.2.13.2 5.2.13 Percentage of adults w antihypertensive treatment - Type of Diabetes = Type 2
