| Pump Therapy |
Valid Value (%) |
NV/NA (%) |
|
| Valid Value |
45715 ( 89.5) |
0 ( 0.0) |
45715 ( 89.5) |
| NV/NA |
5362 ( 10.5) |
0 ( 0.0) |
5362 ( 10.5) |
|
51077 (100.0) |
0 ( 0.0) |
51077 (100.0) |
Table 5.2.12.1 : Pump Therapy (by Type of Diabetes)
| CMH Chi-Square |
p.value |
df |
| 31880.5844 |
0 |
1 |

|
Barplot 5.2.12.1 - Pump Therapy (by Type of Diabetes)
| Pump Therapy |
Type 1 (%) |
Type 2 (%) |
|
| Treated |
553 ( 5.4) |
5193 ( 14.7) |
5746 ( 12.6) |
| Not Treated |
9768 ( 94.6) |
30201 ( 85.3) |
39969 ( 87.4) |
|
10321 ( 22.6) |
35394 ( 77.4) |
45715 (100.0) |
Table 5.2.12.2 : Pump Therapy (by Type of Diabetes)
| CMH Chi-Square |
p.value |
df |
| 629.9517 |
0 |
1 |

|
Barplot 5.2.12.2 - Pump Therapy (by Type of Diabetes)

|
Barplot 5.2.12.2a - Pump Therapy (by Data Source, Type of Diabetes = Type 1)

|
Barplot 5.2.12.2b - Pump Therapy (by Data Source, Type of Diabetes = Type 2)
| s |
O |
E |
N |
CR |
AR |
C.I. (95%) |
[O-E]/E % |
C.I. [O-E]/E (95%) |
| 18 |
9 |
0 |
9 |
100.0 |
100.0 |
( 0.0;100.0) |
Inf |
( -Inf; Inf) |
| 14 |
13 |
1 |
13 |
100.0 |
69.7 |
( 55.9; 83.4) |
1200.0 |
(1021.7;1378.3) |
| 07 |
163 |
30 |
196 |
83.2 |
29.1 |
( 27.3; 30.9) |
443.3 |
( 431.7; 455.0) |
| 01 |
5 |
2 |
46 |
10.9 |
13.4 |
( 4.0; 22.8) |
150.0 |
( -65.7; 365.7) |
| 06 |
49 |
22 |
480 |
10.2 |
11.9 |
( 9.7; 14.1) |
122.7 |
( 74.5; 171.0) |
| 04 |
253 |
173 |
2959 |
8.6 |
7.8 |
( 7.1; 8.6) |
46.2 |
( 33.3; 59.2) |
| 10 |
39 |
30 |
709 |
5.5 |
7.0 |
( 5.1; 8.8) |
30.0 |
( -14.2; 74.2) |
| 08 |
2 |
4 |
127 |
1.6 |
2.7 |
( -3.5; 8.9) |
-50.0 |
(-246.4; 146.4) |
| 17 |
20 |
125 |
2465 |
0.8 |
0.9 |
( 0.0; 1.8) |
-84.0 |
(-101.7; -66.3) |
| 12 |
0 |
152 |
3317 |
0.0 |
0.0 |
( -0.8; 0.8) |
-100.0 |
(-117.6; -82.4) |
| T |
553 |
|
10321 |
5.4 |
|
|
|
|
Table 5.2.12.3 - Standardized Estimates:
5.2.12 Percentage of adults w Pump Therapy
(Type of Diabetes = Type 1 )
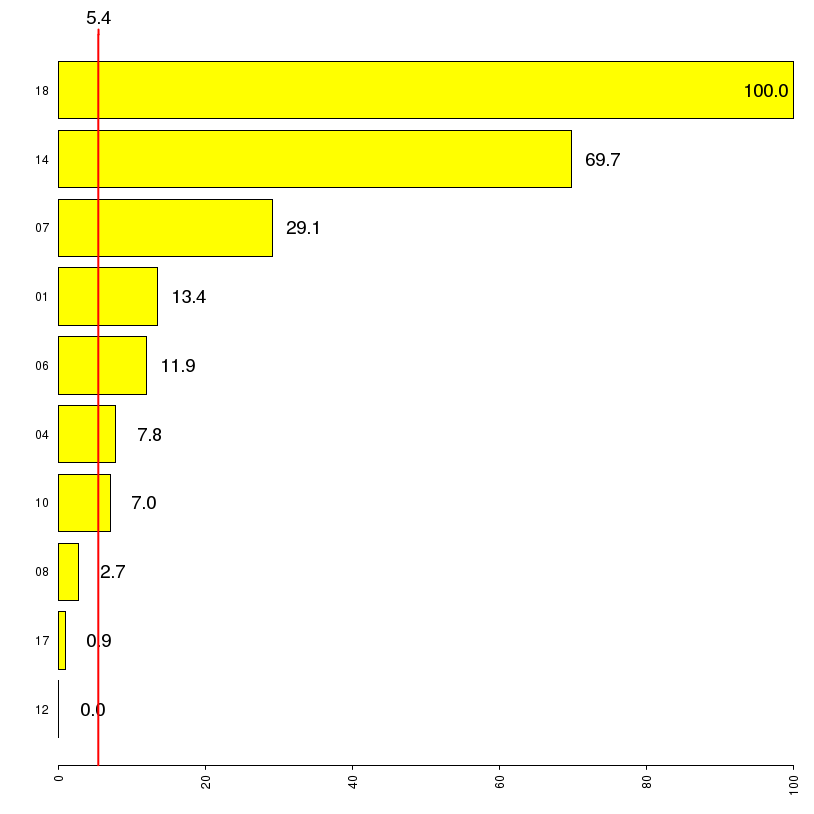
|
Barplots (Adjusted Rates): 5.2.12.1 5.2.12 Percentage of adults w Pump Therapy - Type of Diabetes = Type 1

|
Forest plots: 5.2.12.1 5.2.12 Percentage of adults w Pump Therapy - Type of Diabetes = Type 1
| s |
O |
E |
N |
CR |
AR |
C.I. (95%) |
[O-E]/E % |
C.I. [O-E]/E (95%) |
| 01 |
169 |
38 |
169 |
100.0 |
100.0 |
(115.8;100.0) |
344.7 |
( 310.6;378.9) |
| 06 |
3708 |
941 |
3708 |
100.0 |
100.0 |
(107.9;100.0) |
294.0 |
( 288.2;299.9) |
| 18 |
5142 |
1916 |
5156 |
99.7 |
74.5 |
( 73.5; 75.5) |
168.4 |
( 165.8;171.0) |
| 04 |
774 |
1334 |
5502 |
14.1 |
16.1 |
( 14.8; 17.4) |
-42.0 |
( -47.2;-36.8) |
| 10 |
21 |
1022 |
3797 |
0.6 |
0.6 |
( -0.8; 2.0) |
-97.9 |
(-103.2;-92.7) |
| 08 |
1 |
109 |
402 |
0.2 |
0.3 |
( -4.1; 4.6) |
-99.1 |
(-115.1;-83.1) |
| 17 |
13 |
2632 |
9485 |
0.1 |
0.1 |
( -0.7; 1.0) |
-99.5 |
(-102.7;-96.3) |
| 12 |
0 |
1829 |
7175 |
0.0 |
0.0 |
( -1.1; 1.1) |
-100.0 |
(-104.2;-95.8) |
| T |
9828 |
|
35394 |
27.8 |
|
|
|
|
Table 5.2.12.4 - Standardized Estimates:
5.2.12 Percentage of adults w Pump Therapy
(Type of Diabetes = Type 2 )

|
Barplots (Adjusted Rates): 5.2.12.2 5.2.12 Percentage of adults w Pump Therapy - Type of Diabetes = Type 2

|
Forest plots: 5.2.12.2 5.2.12 Percentage of adults w Pump Therapy - Type of Diabetes = Type 2
