
|
| BIRO Report site: 319761ea64b939fa1be95f0c7eb6e8c07691f006 |
| Reference date: 18/02/12 |
| Parameter: 5.2.1 Percentage of Adults w 1+ HbA1c tests in 12 mts |
| HbA1c done | Valid Value (%) | NV/NA (%) | |
|---|---|---|---|
| Valid Value | 191443 (100.0) | 0 ( 0.0) | 191443 (100.0) |
| NV/NA | 0 ( 0.0) | 0 ( 0.0) | 0 ( 0.0) |
| 191443 (100.0) | 0 ( 0.0) | 191443 (100.0) |
| CMH Chi-Square |
|---|
| Too many cells have 0 obs |

|
| HbA1c done | Type 1 (%) | Type 2 (%) | |
|---|---|---|---|
| at least one test | 16925 ( 89.8) | 146397 ( 84.8) | 163322 ( 85.3) |
| no test | 1913 ( 10.2) | 26208 ( 15.2) | 28121 ( 14.7) |
| 18838 ( 9.8) | 172605 ( 90.2) | 191443 (100.0) |
| CMH Chi-Square | p.value | df |
|---|---|---|
| 342.3509 | 0 | 1 |

|

|

|
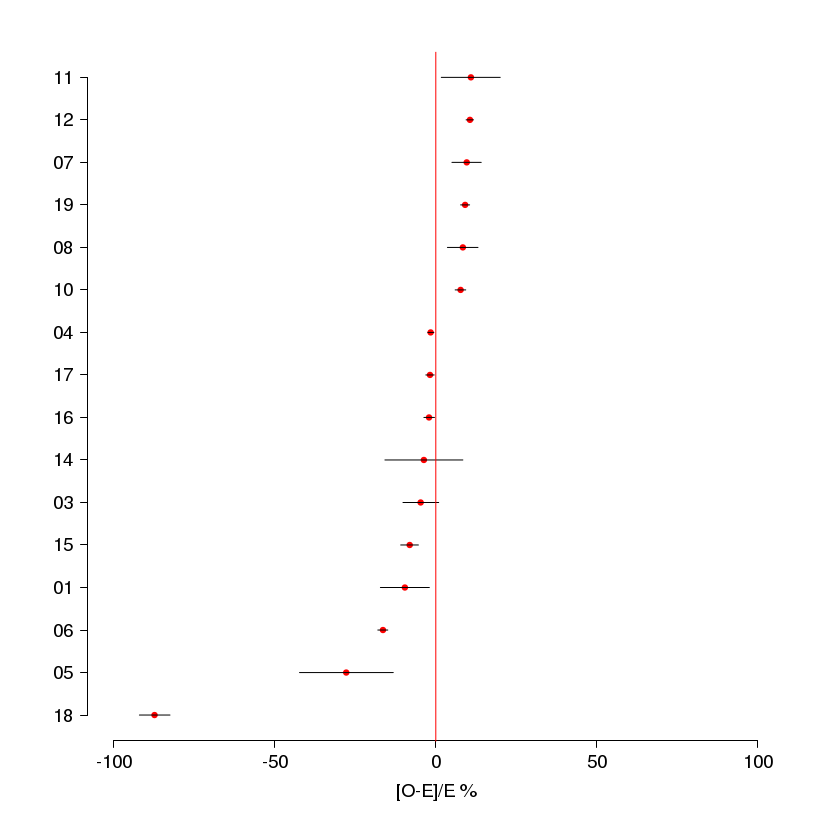
| s | O | E | N | CR | AR | C.I. (95%) | [O-E]/E % | C.I. [O-E]/E (95%) |
|---|---|---|---|---|---|---|---|---|
| 11 | 51 | 46 | 51 | 100.0 | 99.6 | ( 91.4;100.0) | 10.9 | ( 1.7; 20.0) |
| 12 | 3333 | 3014 | 3359 | 99.2 | 99.4 | ( 98.3;100.0) | 10.6 | ( 9.4; 11.7) |
| 07 | 195 | 178 | 196 | 99.5 | 98.4 | ( 94.3;100.0) | 9.6 | ( 5.0; 14.1) |
| 19 | 2017 | 1849 | 2049 | 98.4 | 98.0 | ( 96.7; 99.3) | 9.1 | ( 7.7; 10.5) |
| 08 | 181 | 167 | 185 | 97.8 | 97.4 | ( 93.1;100.0) | 8.4 | ( 3.6; 13.1) |
| 10 | 1604 | 1490 | 1662 | 96.5 | 96.7 | ( 95.3; 98.2) | 7.7 | ( 6.0; 9.3) |
| 04 | 3800 | 3860 | 4287 | 88.6 | 88.4 | ( 87.6; 89.3) | -1.6 | ( -2.5; -0.6) |
| 17 | 2228 | 2269 | 2528 | 88.1 | 88.2 | ( 87.0; 89.4) | -1.8 | ( -3.1; -0.5) |
| 16 | 1429 | 1459 | 1619 | 88.3 | 88.0 | ( 86.5; 89.4) | -2.1 | ( -3.7; -0.4) |
| 14 | 26 | 27 | 30 | 86.7 | 86.5 | ( 75.6; 97.4) | -3.7 | (-15.8; 8.4) |
| 03 | 102 | 107 | 114 | 89.5 | 85.6 | ( 80.4; 90.9) | -4.7 | (-10.2; 0.9) |
| 15 | 531 | 578 | 651 | 81.6 | 82.5 | ( 80.1; 85.0) | -8.1 | (-10.9; -5.4) |
| 01 | 47 | 52 | 53 | 88.7 | 81.2 | ( 73.8; 88.6) | -9.6 | (-17.2; -2.0) |
| 06 | 1341 | 1605 | 1792 | 74.8 | 75.1 | ( 73.7; 76.5) | -16.4 | (-18.0;-14.9) |
| 05 | 13 | 18 | 19 | 68.4 | 64.9 | ( 51.1; 78.7) | -27.8 | (-42.3;-13.2) |
| 18 | 27 | 212 | 243 | 11.1 | 11.4 | ( 7.3; 15.6) | -87.3 | (-92.0;-82.5) |
| T | 16925 | 18838 | 89.8 |

|
|
| s | O | E | N | CR | AR | C.I. (95%) | [O-E]/E % | C.I. [O-E]/E (95%) |
|---|---|---|---|---|---|---|---|---|
| 13 | 4829 | 4130 | 4884 | 98.9 | 99.2 | ( 98.2;100.0) | 16.9 | ( 15.7; 18.1) |
| 09 | 1282 | 1109 | 1306 | 98.2 | 98.0 | ( 96.1;100.0) | 15.6 | ( 13.3; 17.9) |
| 12 | 7227 | 6265 | 7304 | 98.9 | 97.8 | ( 97.1; 98.6) | 15.4 | ( 14.4; 16.3) |
| 19 | 2768 | 2418 | 2859 | 96.8 | 97.1 | ( 95.8; 98.4) | 14.5 | ( 12.9; 16.0) |
| 08 | 1149 | 1008 | 1191 | 96.5 | 96.7 | ( 94.6; 98.7) | 14.0 | ( 11.6; 16.4) |
| 10 | 11933 | 10643 | 12560 | 95.0 | 95.1 | ( 94.5; 95.7) | 12.1 | ( 11.4; 12.9) |
| 16 | 16169 | 14998 | 17831 | 90.7 | 91.4 | ( 90.9; 92.0) | 7.8 | ( 7.2; 8.4) |
| 17 | 44829 | 43073 | 50927 | 88.0 | 88.3 | ( 88.0; 88.6) | 4.1 | ( 3.7; 4.4) |
| 04 | 32407 | 31638 | 37064 | 87.4 | 86.9 | ( 86.5; 87.2) | 2.4 | ( 2.0; 2.8) |
| 01 | 618 | 640 | 745 | 83.0 | 81.9 | ( 79.4; 84.4) | -3.4 | ( -6.3; -0.5) |
| 06 | 18446 | 19479 | 22804 | 80.9 | 80.3 | ( 79.9; 80.8) | -5.3 | ( -5.8; -4.8) |
| 15 | 2908 | 3170 | 3782 | 76.9 | 77.8 | ( 76.6; 79.0) | -8.3 | ( -9.7; -6.9) |
| 05 | 1081 | 1482 | 1765 | 61.2 | 61.9 | ( 60.1; 63.6) | -27.1 | (-29.1;-25.0) |
| 03 | 69 | 95 | 108 | 63.9 | 61.6 | ( 55.3; 67.9) | -27.4 | (-34.5;-20.2) |
| 18 | 682 | 6269 | 7475 | 9.1 | 9.2 | ( 8.4; 10.1) | -89.1 | (-90.1;-88.1) |
| T | 146397 | 172605 | 84.8 |

|

|
| Copyright BIRO Consortium |