| Self Monitoring |
Valid Value (%) |
NV/NA (%) |
|
| Valid Value |
30800 ( 35.5) |
0 ( 0.0) |
30800 ( 35.5) |
| NV/NA |
56013 ( 64.5) |
0 ( 0.0) |
56013 ( 64.5) |
|
86813 (100.0) |
0 ( 0.0) |
86813 (100.0) |
Table 3.3.5.1.1 : Self Monitoring (by Type of Diabetes)
| CMH Chi-Square |
p.value |
df |
| 7322.5827 |
0 |
1 |

|
Barplot 3.3.5.1.1 - Self Monitoring (by Type of Diabetes)
| Self Monitoring |
Type 1 (%) |
Type 2 (%) |
Other Type (%) |
|
| Urine |
10 ( 0.2) |
460 ( 1.9) |
8 ( 2.1) |
478 ( 1.6) |
| Blood Glucose |
5966 ( 89.9) |
22399 ( 94.2) |
345 ( 91.0) |
28710 ( 93.2) |
| Both |
660 ( 9.9) |
926 ( 3.9) |
26 ( 6.9) |
1612 ( 5.2) |
|
6636 ( 21.5) |
23785 ( 77.2) |
379 ( 1.2) |
30800 (100.0) |
Table 3.3.5.1.2 : Self Monitoring (by Type of Diabetes)
| CMH Chi-Square |
p.value |
df |
| 482.5306 |
0 |
4 |

|
Barplot 3.3.5.1.2 - Self Monitoring (by Type of Diabetes)

|
Barplot 3.3.5.1.2a - Self Monitoring (by Data Source, Type of Diabetes = Type 1)

|
Barplot 3.3.5.1.2b - Self Monitoring (by Data Source, Type of Diabetes = Type 2)

|
Barplot 3.3.5.1.2c - Self Monitoring (by Data Source, Type of Diabetes = Other Type)
| Self Monitoring |
Valid Value (%) |
NV/NA (%) |
|
| Valid Value |
30800 ( 35.5) |
0 ( 0.0) |
30800 ( 35.5) |
| NV/NA |
56013 ( 64.5) |
0 ( 0.0) |
56013 ( 64.5) |
|
86813 (100.0) |
0 ( 0.0) |
86813 (100.0) |
Table 3.3.5.1.3 : Self Monitoring (by Age Classes)
| CMH Chi-Square |
p.value |
df |
| 7322.5827 |
0 |
1 |

|
Barplot 3.3.5.1.3 - Self Monitoring (by Age Classes)
| Self Monitoring |
<15 (%) |
[15 - 25) (%) |
[25 - 50) (%) |
[50 - 65) (%) |
[65 - 80) (%) |
>=80 (%) |
|
| Urine |
0 ( 0.0) |
3 ( 0.4) |
48 ( 1.0) |
168 ( 1.8) |
210 ( 1.7) |
49 ( 1.5) |
478 ( 1.6) |
| Blood Glucose |
87 ( 20.8) |
618 ( 77.6) |
4746 ( 95.6) |
8841 ( 93.8) |
11344 ( 94.5) |
3074 ( 96.5) |
28710 ( 93.2) |
| Both |
332 ( 79.2) |
175 ( 22.0) |
168 ( 3.4) |
419 ( 4.4) |
454 ( 3.8) |
64 ( 2.0) |
1612 ( 5.2) |
|
419 ( 1.4) |
796 ( 2.6) |
4962 ( 16.1) |
9428 ( 30.6) |
12008 ( 39.0) |
3187 ( 10.3) |
30800 (100.0) |
Table 3.3.5.1.4 : Self Monitoring (by Age Classes)
| CMH Chi-Square |
p.value |
df |
| 5262.8696 |
0 |
10 |

|
Barplot 3.3.5.1.4 - Self Monitoring (by Age Classes)

|
Barplot 3.3.5.1.4a - Self Monitoring (by Data Source, Age Classes = <15)

|
Barplot 3.3.5.1.4b - Self Monitoring (by Data Source, Age Classes = [15 - 25))

|
Barplot 3.3.5.1.4c - Self Monitoring (by Data Source, Age Classes = [25 - 50))

|
Barplot 3.3.5.1.4d - Self Monitoring (by Data Source, Age Classes = [50 - 65))

|
Barplot 3.3.5.1.4e - Self Monitoring (by Data Source, Age Classes = [65 - 80))

|
Barplot 3.3.5.1.4f - Self Monitoring (by Data Source, Age Classes = >=80)
| Self Monitoring |
Age Classes |
|
| Valid Value (%) |
NV/NA (%) |
|
| Valid Value |
6636 ( 63.3) |
0 ( 0.0) |
6636 ( 63.3) |
| NV/NA |
3853 ( 36.7) |
0 ( 0.0) |
3853 ( 36.7) |
|
10489 (100.0) |
0 ( 0.0) |
10489 (100.0) |
Table 3.3.5.1.5 : Self Monitoring (by Age Classes, Type of Diabetes = Type 1)
| CMH Chi-Square |
p.value |
df |
| 738.4011 |
0 |
1 |

|
Barplot 3.3.5.1.5 - Self Monitoring (by Age Classes, Type of Diabetes = Type 1)
| Self Monitoring |
Age Classes |
|
| <15 (%) |
[15 - 25) (%) |
[25 - 50) (%) |
[50 - 65) (%) |
[65 - 80) (%) |
>=80 (%) |
|
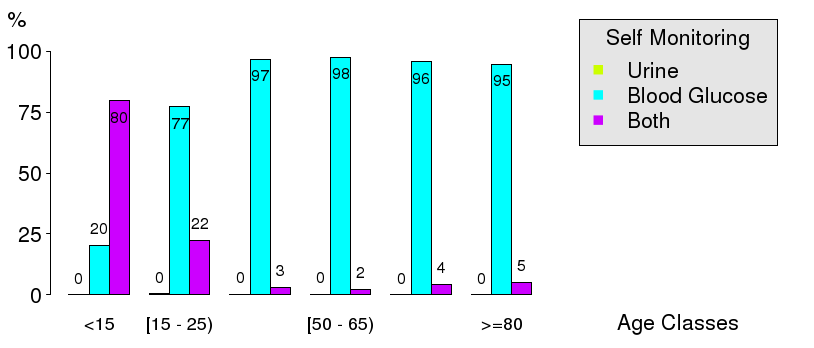
| Urine |
0 ( 0.0) |
3 ( 0.4) |
5 ( 0.2) |
2 ( 0.1) |
0 ( 0.0) |
0 ( 0.0) |
10 ( 0.2) |
| Blood Glucose |
84 ( 20.4) |
578 ( 77.3) |
2849 ( 96.8) |
1623 ( 97.6) |
706 ( 95.8) |
126 ( 94.7) |
5966 ( 89.9) |
| Both |
328 ( 79.6) |
167 ( 22.3) |
89 ( 3.0) |
38 ( 2.3) |
31 ( 4.2) |
7 ( 5.3) |
660 ( 9.9) |
|
412 ( 6.2) |
748 ( 11.3) |
2943 ( 44.3) |
1663 ( 25.1) |
737 ( 11.1) |
133 ( 2.0) |
6636 (100.0) |
Table 3.3.5.1.6 : Self Monitoring (by Age Classes, Type of Diabetes = Type 1)
| CMH Chi-Square |
p.value |
df |
| 2662.6649 |
0 |
10 |
|
Barplot 3.3.5.1.6 - Self Monitoring (by Age Classes, Type of Diabetes = Type 1)

|
Barplot 3.3.5.1.6a - Self Monitoring (by Data Source, Age Classes = <15, Type of Diabetes=Type 1)

|
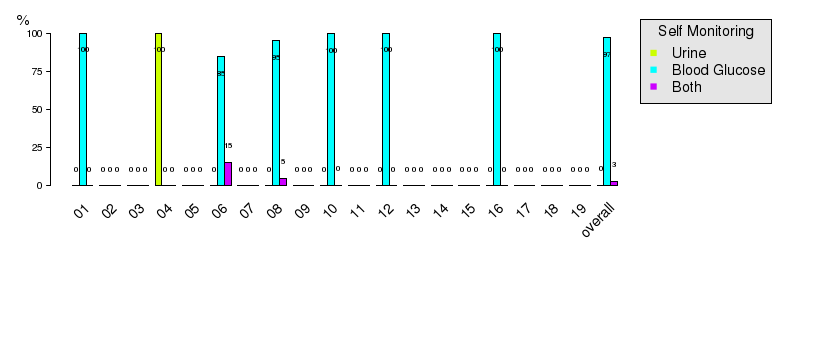
Barplot 3.3.5.1.6b - Self Monitoring (by Data Source, Age Classes = [15 - 25), Type of Diabetes=Type 1)
|
Barplot 3.3.5.1.6c - Self Monitoring (by Data Source, Age Classes = [25 - 50), Type of Diabetes=Type 1)

|
Barplot 3.3.5.1.6d - Self Monitoring (by Data Source, Age Classes = [50 - 65), Type of Diabetes=Type 1)

|
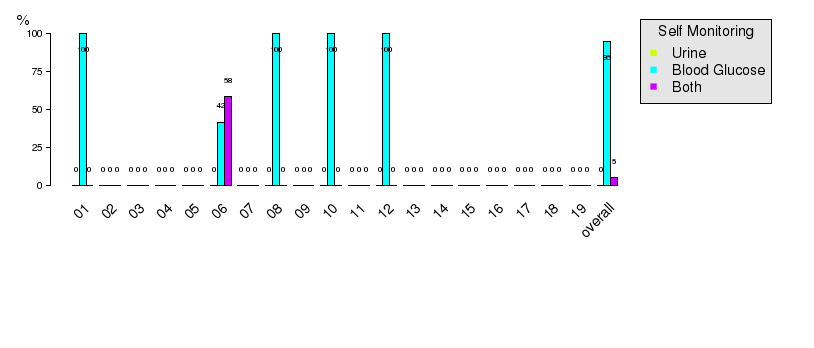
Barplot 3.3.5.1.6e - Self Monitoring (by Data Source, Age Classes = [65 - 80), Type of Diabetes=Type 1)
|
Barplot 3.3.5.1.6f - Self Monitoring (by Data Source, Age Classes = >=80, Type of Diabetes=Type 1)
| Self Monitoring |
Age Classes |
|
| Valid Value (%) |
NV/NA (%) |
|
| Valid Value |
23785 ( 31.7) |
0 ( 0.0) |
23785 ( 31.7) |
| NV/NA |
51301 ( 68.3) |
0 ( 0.0) |
51301 ( 68.3) |
|
75086 (100.0) |
0 ( 0.0) |
75086 (100.0) |
Table 3.3.5.1.7 : Self Monitoring (by Age Classes, Type of Diabetes = Type 2)
| CMH Chi-Square |
p.value |
df |
| 10083.5077 |
0 |
1 |

|
Barplot 3.3.5.1.7 - Self Monitoring (by Age Classes, Type of Diabetes = Type 2)
| Self Monitoring |
Age Classes |
|
| <15 (%) |
[15 - 25) (%) |
[25 - 50) (%) |
[50 - 65) (%) |
[65 - 80) (%) |
>=80 (%) |
|
| Urine |
0 ( 0.0) |
0 ( 0.0) |
38 ( 2.1) |
164 ( 2.1) |
209 ( 1.9) |
49 ( 1.6) |
460 ( 1.9) |
| Blood Glucose |
2 ( 50.0) |
17 ( 94.4) |
1733 ( 94.1) |
7131 ( 92.9) |
10572 ( 94.4) |
2944 ( 96.5) |
22399 ( 94.2) |
| Both |
2 ( 50.0) |
1 ( 5.6) |
70 ( 3.8) |
377 ( 4.9) |
419 ( 3.7) |
57 ( 1.9) |
926 ( 3.9) |
|
4 ( 0.0) |
18 ( 0.1) |
1841 ( 7.7) |
7672 ( 32.3) |
11200 ( 47.1) |
3050 ( 12.8) |
23785 (100.0) |
Table 3.3.5.1.8 : Self Monitoring (by Age Classes, Type of Diabetes = Type 2)
| CMH Chi-Square |
p.value |
df |
| 83.401 |
0 |
10 |

|
Barplot 3.3.5.1.8 - Self Monitoring (by Age Classes, Type of Diabetes = Type 2)

|
Barplot 3.3.5.1.8a - Self Monitoring (by Data Source, Age Classes = <15, Type of Diabetes=Type 2)

|
Barplot 3.3.5.1.8b - Self Monitoring (by Data Source, Age Classes = [15 - 25), Type of Diabetes=Type 2)

|
Barplot 3.3.5.1.8c - Self Monitoring (by Data Source, Age Classes = [25 - 50), Type of Diabetes=Type 2)

|
Barplot 3.3.5.1.8d - Self Monitoring (by Data Source, Age Classes = [50 - 65), Type of Diabetes=Type 2)

|
Barplot 3.3.5.1.8e - Self Monitoring (by Data Source, Age Classes = [65 - 80), Type of Diabetes=Type 2)

|
Barplot 3.3.5.1.8f - Self Monitoring (by Data Source, Age Classes = >=80, Type of Diabetes=Type 2)
| Self Monitoring |
Age Classes |
|
| Valid Value (%) |
NV/NA (%) |
|
| Valid Value |
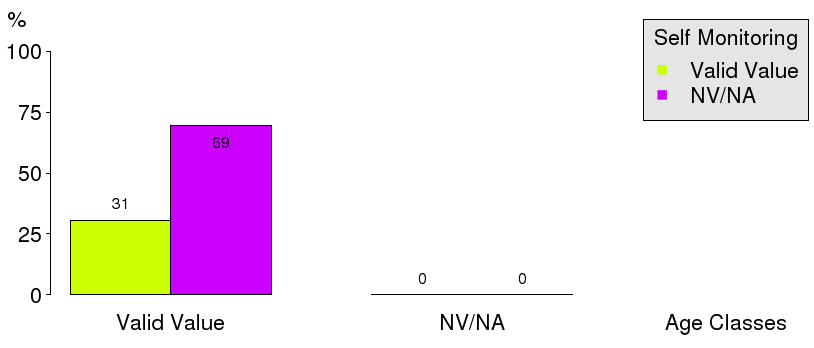
379 ( 30.6) |
0 ( 0.0) |
379 ( 30.6) |
| NV/NA |
859 ( 69.4) |
0 ( 0.0) |
859 ( 69.4) |
|
1238 (100.0) |
0 ( 0.0) |
1238 (100.0) |
Table 3.3.5.1.9 : Self Monitoring (by Age Classes, Type of Diabetes = Other Type)
| CMH Chi-Square |
p.value |
df |
| 186.1066 |
0 |
1 |
|
Barplot 3.3.5.1.9 - Self Monitoring (by Age Classes, Type of Diabetes = Other Type)
| Self Monitoring |
Age Classes |
|
| <15 (%) |
[15 - 25) (%) |
[25 - 50) (%) |
[50 - 65) (%) |
[65 - 80) (%) |
>=80 (%) |
|
| Urine |
0 ( 0.0) |
0 ( 0.0) |
5 ( 2.8) |
2 ( 2.2) |
1 ( 1.4) |
0 ( 0.0) |
8 ( 2.1) |
| Blood Glucose |
1 ( 33.3) |
23 ( 76.7) |
164 ( 92.1) |
87 ( 93.5) |
66 ( 93.0) |
4 (100.0) |
345 ( 91.0) |
| Both |
2 ( 66.7) |
7 ( 23.3) |
9 ( 5.1) |
4 ( 4.3) |
4 ( 5.6) |
0 ( 0.0) |
26 ( 6.9) |
|
3 ( 0.8) |
30 ( 7.9) |
178 ( 47.0) |
93 ( 24.5) |
71 ( 18.7) |
4 ( 1.1) |
379 (100.0) |
Table 3.3.5.1.10 : Self Monitoring (by Age Classes, Type of Diabetes = Other Type)
| CMH Chi-Square |
p.value |
df |
| 32.9597 |
3e-04 |
10 |

|
Barplot 3.3.5.1.10 - Self Monitoring (by Age Classes, Type of Diabetes = Other Type)

|
Barplot 3.3.5.1.10a - Self Monitoring (by Data Source, Age Classes = <15, Type of Diabetes=Other Type)

|
Barplot 3.3.5.1.10b - Self Monitoring (by Data Source, Age Classes = [15 - 25), Type of Diabetes=Other Type)

|
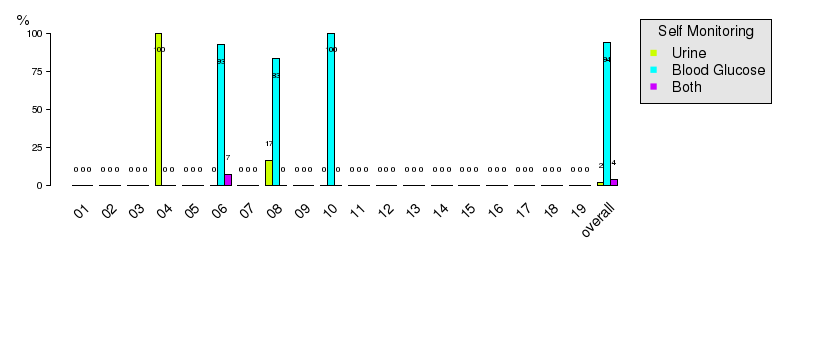
Barplot 3.3.5.1.10c - Self Monitoring (by Data Source, Age Classes = [25 - 50), Type of Diabetes=Other Type)
|
Barplot 3.3.5.1.10d - Self Monitoring (by Data Source, Age Classes = [50 - 65), Type of Diabetes=Other Type)

|
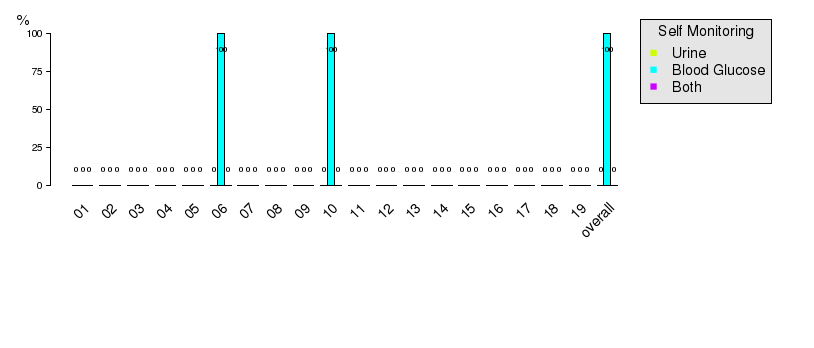
Barplot 3.3.5.1.10e - Self Monitoring (by Data Source, Age Classes = [65 - 80), Type of Diabetes=Other Type)
|
Barplot 3.3.5.1.10f - Self Monitoring (by Data Source, Age Classes = >=80, Type of Diabetes=Other Type)
