| Pump Therapy |
Valid Value (%) |
NV/NA (%) |
|
| Valid Value |
133876 ( 88.4) |
0 ( 0.0) |
133876 ( 88.4) |
| NV/NA |
17614 ( 11.6) |
0 ( 0.0) |
17614 ( 11.6) |
|
151490 (100.0) |
0 ( 0.0) |
151490 (100.0) |
Table 3.3.4.4.5.1 : Pump Therapy (by Type of Diabetes)
| CMH Chi-Square |
p.value |
df |
| 89226.039 |
0 |
1 |

|
Barplot 3.3.4.4.5.1 - Pump Therapy (by Type of Diabetes)
| Pump Therapy |
Type 1 (%) |
Type 2 (%) |
Other Type (%) |
|
| Yes |
1399 ( 10.6) |
5608 ( 4.7) |
559 ( 22.5) |
7566 ( 5.7) |
| No |
11743 ( 89.4) |
112641 ( 95.3) |
1926 ( 77.5) |
126310 ( 94.3) |
|
13142 ( 9.8) |
118249 ( 88.3) |
2485 ( 1.9) |
133876 (100.0) |
Table 3.3.4.4.5.2 : Pump Therapy (by Type of Diabetes)
| CMH Chi-Square |
p.value |
df |
| 2120.0457 |
0 |
2 |

|
Barplot 3.3.4.4.5.2 - Pump Therapy (by Type of Diabetes)

|
Barplot 3.3.4.4.5.2a - Pump Therapy (by Data Source, Type of Diabetes = Type 1)

|
Barplot 3.3.4.4.5.2b - Pump Therapy (by Data Source, Type of Diabetes = Type 2)

|
Barplot 3.3.4.4.5.2c - Pump Therapy (by Data Source, Type of Diabetes = Other Type)
| Pump Therapy |
Valid Value (%) |
NV/NA (%) |
|
| Valid Value |
133876 ( 88.4) |
0 ( 0.0) |
133876 ( 88.4) |
| NV/NA |
17614 ( 11.6) |
0 ( 0.0) |
17614 ( 11.6) |
|
151490 (100.0) |
0 ( 0.0) |
151490 (100.0) |
Table 3.3.4.4.5.3 : Pump Therapy (by Age Classes)
| CMH Chi-Square |
p.value |
df |
| 89226.039 |
0 |
1 |

|
Barplot 3.3.4.4.5.3 - Pump Therapy (by Age Classes)
| Pump Therapy |
<15 (%) |
[15 - 25) (%) |
[25 - 50) (%) |
[50 - 65) (%) |
[65 - 80) (%) |
>=80 (%) |
|
| Yes |
379 ( 56.4) |
397 ( 22.3) |
835 ( 5.8) |
1871 ( 4.5) |
2989 ( 5.1) |
1095 ( 6.6) |
7566 ( 5.7) |
| No |
293 ( 43.6) |
1384 ( 77.7) |
13682 ( 94.2) |
39458 ( 95.5) |
56103 ( 94.9) |
15390 ( 93.4) |
126310 ( 94.3) |
|
672 ( 0.5) |
1781 ( 1.3) |
14517 ( 10.8) |
41329 ( 30.9) |
59092 ( 44.1) |
16485 ( 12.3) |
133876 (100.0) |
Table 3.3.4.4.5.4 : Pump Therapy (by Age Classes)
| CMH Chi-Square |
p.value |
df |
| 4338.0267 |
0 |
5 |

|
Barplot 3.3.4.4.5.4 - Pump Therapy (by Age Classes)

|
Barplot 3.3.4.4.5.4a - Pump Therapy (by Data Source, Age Classes = <15)

|
Barplot 3.3.4.4.5.4b - Pump Therapy (by Data Source, Age Classes = [15 - 25))

|
Barplot 3.3.4.4.5.4c - Pump Therapy (by Data Source, Age Classes = [25 - 50))

|
Barplot 3.3.4.4.5.4d - Pump Therapy (by Data Source, Age Classes = [50 - 65))

|
Barplot 3.3.4.4.5.4e - Pump Therapy (by Data Source, Age Classes = [65 - 80))

|
Barplot 3.3.4.4.5.4f - Pump Therapy (by Data Source, Age Classes = >=80)
| Pump Therapy |
Age Classes |
|
| Valid Value (%) |
NV/NA (%) |
|
| Valid Value |
13142 ( 89.5) |
0 ( 0.0) |
13142 ( 89.5) |
| NV/NA |
1535 ( 10.5) |
0 ( 0.0) |
1535 ( 10.5) |
|
14677 (100.0) |
0 ( 0.0) |
14677 (100.0) |
Table 3.3.4.4.5.5 : Pump Therapy (by Age Classes, Type of Diabetes = Type 1)
| CMH Chi-Square |
p.value |
df |
| 9179.1544 |
0 |
1 |

|
Barplot 3.3.4.4.5.5 - Pump Therapy (by Age Classes, Type of Diabetes = Type 1)
| Pump Therapy |
Age Classes |
|
| <15 (%) |
[15 - 25) (%) |
[25 - 50) (%) |
[50 - 65) (%) |
[65 - 80) (%) |
>=80 (%) |
|
| Yes |
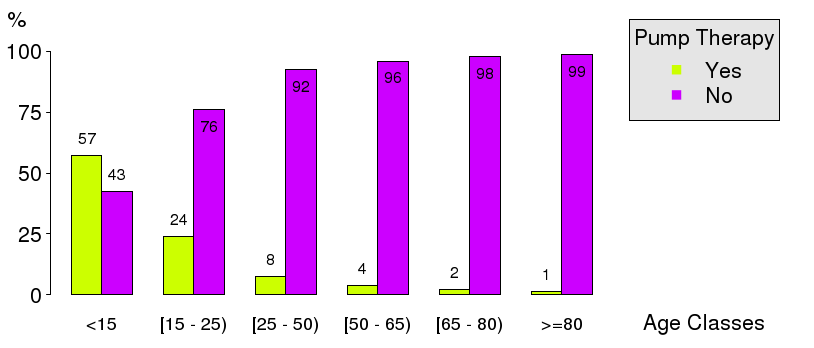
376 ( 57.4) |
394 ( 23.9) |
468 ( 7.7) |
126 ( 4.0) |
32 ( 2.3) |
3 ( 1.4) |
1399 ( 10.6) |
| No |
279 ( 42.6) |
1254 ( 76.1) |
5616 ( 92.3) |
3006 ( 96.0) |
1379 ( 97.7) |
209 ( 98.6) |
11743 ( 89.4) |
|
655 ( 5.0) |
1648 ( 12.5) |
6084 ( 46.3) |
3132 ( 23.8) |
1411 ( 10.7) |
212 ( 1.6) |
13142 (100.0) |
Table 3.3.4.4.5.6 : Pump Therapy (by Age Classes, Type of Diabetes = Type 1)
| CMH Chi-Square |
p.value |
df |
| 2133.5876 |
0 |
5 |
|
Barplot 3.3.4.4.5.6 - Pump Therapy (by Age Classes, Type of Diabetes = Type 1)
|
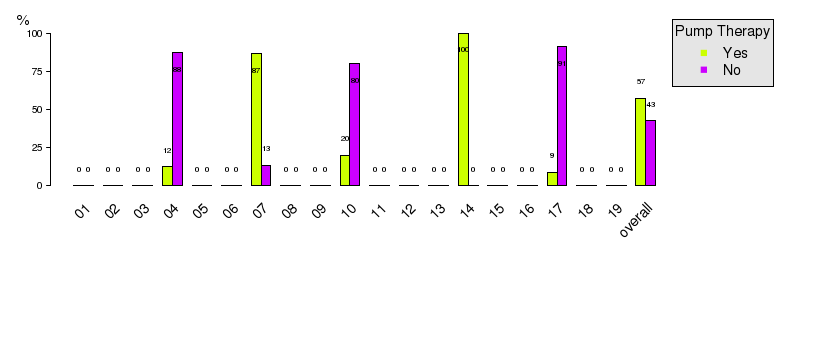
Barplot 3.3.4.4.5.6a - Pump Therapy (by Data Source, Age Classes = <15, Type of Diabetes=Type 1)

|
Barplot 3.3.4.4.5.6b - Pump Therapy (by Data Source, Age Classes = [15 - 25), Type of Diabetes=Type 1)

|
Barplot 3.3.4.4.5.6c - Pump Therapy (by Data Source, Age Classes = [25 - 50), Type of Diabetes=Type 1)

|
Barplot 3.3.4.4.5.6d - Pump Therapy (by Data Source, Age Classes = [50 - 65), Type of Diabetes=Type 1)
|
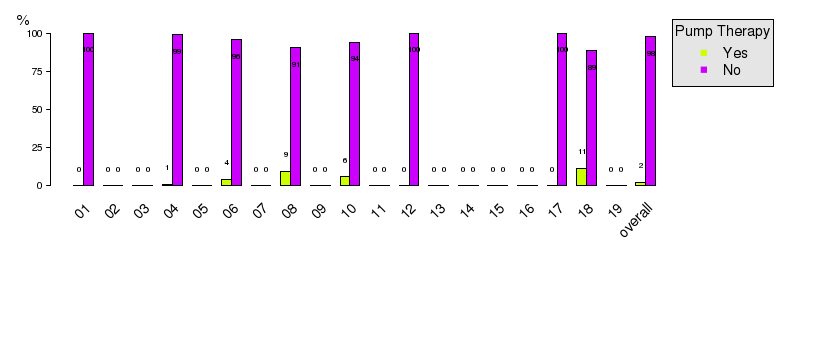
Barplot 3.3.4.4.5.6e - Pump Therapy (by Data Source, Age Classes = [65 - 80), Type of Diabetes=Type 1)

|
Barplot 3.3.4.4.5.6f - Pump Therapy (by Data Source, Age Classes = >=80, Type of Diabetes=Type 1)
| Pump Therapy |
Age Classes |
|
| Valid Value (%) |
NV/NA (%) |
|
| Valid Value |
118249 ( 88.2) |
0 ( 0.0) |
118249 ( 88.2) |
| NV/NA |
15757 ( 11.8) |
0 ( 0.0) |
15757 ( 11.8) |
|
134006 (100.0) |
0 ( 0.0) |
134006 (100.0) |
Table 3.3.4.4.5.7 : Pump Therapy (by Age Classes, Type of Diabetes = Type 2)
| CMH Chi-Square |
p.value |
df |
| 78389.1025 |
0 |
1 |

|
Barplot 3.3.4.4.5.7 - Pump Therapy (by Age Classes, Type of Diabetes = Type 2)
| Pump Therapy |
Age Classes |
|
| <15 (%) |
[15 - 25) (%) |
[25 - 50) (%) |
[50 - 65) (%) |
[65 - 80) (%) |
>=80 (%) |
|
| Yes |
2 ( 18.2) |
3 ( 4.1) |
321 ( 4.3) |
1548 ( 4.1) |
2725 ( 4.8) |
1009 ( 6.3) |
5608 ( 4.7) |
| No |
9 ( 81.8) |
71 ( 95.9) |
7147 ( 95.7) |
36023 ( 95.9) |
54304 ( 95.2) |
15087 ( 93.7) |
112641 ( 95.3) |
|
11 ( 0.0) |
74 ( 0.1) |
7468 ( 6.3) |
37571 ( 31.8) |
57029 ( 48.2) |
16096 ( 13.6) |
118249 (100.0) |
Table 3.3.4.4.5.8 : Pump Therapy (by Age Classes, Type of Diabetes = Type 2)
| CMH Chi-Square |
p.value |
df |
| 123.089 |
0 |
5 |

|
Barplot 3.3.4.4.5.8 - Pump Therapy (by Age Classes, Type of Diabetes = Type 2)

|
Barplot 3.3.4.4.5.8a - Pump Therapy (by Data Source, Age Classes = <15, Type of Diabetes=Type 2)

|
Barplot 3.3.4.4.5.8b - Pump Therapy (by Data Source, Age Classes = [15 - 25), Type of Diabetes=Type 2)

|
Barplot 3.3.4.4.5.8c - Pump Therapy (by Data Source, Age Classes = [25 - 50), Type of Diabetes=Type 2)

|
Barplot 3.3.4.4.5.8d - Pump Therapy (by Data Source, Age Classes = [50 - 65), Type of Diabetes=Type 2)

|
Barplot 3.3.4.4.5.8e - Pump Therapy (by Data Source, Age Classes = [65 - 80), Type of Diabetes=Type 2)
|
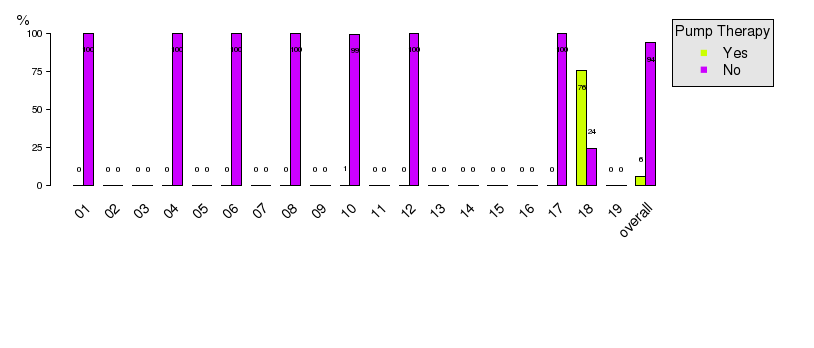
Barplot 3.3.4.4.5.8f - Pump Therapy (by Data Source, Age Classes = >=80, Type of Diabetes=Type 2)
| Pump Therapy |
Age Classes |
|
| Valid Value (%) |
NV/NA (%) |
|
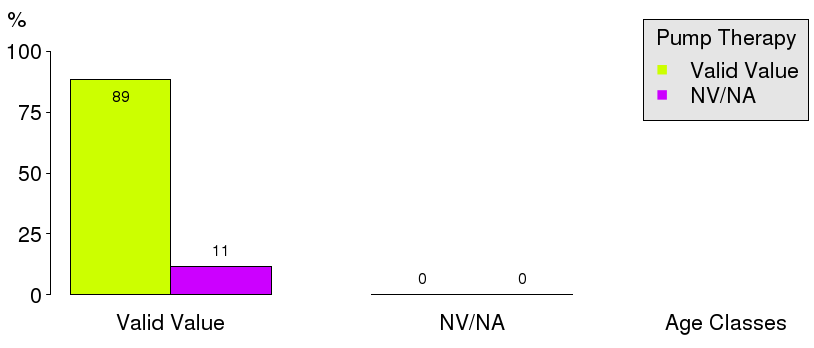
| Valid Value |
2485 ( 88.5) |
0 ( 0.0) |
2485 ( 88.5) |
| NV/NA |
322 ( 11.5) |
0 ( 0.0) |
322 ( 11.5) |
|
2807 (100.0) |
0 ( 0.0) |
2807 (100.0) |
Table 3.3.4.4.5.9 : Pump Therapy (by Age Classes, Type of Diabetes = Other Type)
| CMH Chi-Square |
p.value |
df |
| 1666.7506 |
0 |
1 |
|
Barplot 3.3.4.4.5.9 - Pump Therapy (by Age Classes, Type of Diabetes = Other Type)
| Pump Therapy |
Age Classes |
|
| <15 (%) |
[15 - 25) (%) |
[25 - 50) (%) |
[50 - 65) (%) |
[65 - 80) (%) |
>=80 (%) |
|
| Yes |
1 ( 16.7) |
0 ( 0.0) |
46 ( 4.8) |
197 ( 31.5) |
232 ( 35.6) |
83 ( 46.9) |
559 ( 22.5) |
| No |
5 ( 83.3) |
59 (100.0) |
919 ( 95.2) |
429 ( 68.5) |
420 ( 64.4) |
94 ( 53.1) |
1926 ( 77.5) |
|
6 ( 0.2) |
59 ( 2.4) |
965 ( 38.8) |
626 ( 25.2) |
652 ( 26.2) |
177 ( 7.1) |
2485 (100.0) |
Table 3.3.4.4.5.10 : Pump Therapy (by Age Classes, Type of Diabetes = Other Type)
| CMH Chi-Square |
p.value |
df |
| 344.604 |
0 |
5 |

|
Barplot 3.3.4.4.5.10 - Pump Therapy (by Age Classes, Type of Diabetes = Other Type)

|
Barplot 3.3.4.4.5.10a - Pump Therapy (by Data Source, Age Classes = <15, Type of Diabetes=Other Type)

|
Barplot 3.3.4.4.5.10b - Pump Therapy (by Data Source, Age Classes = [15 - 25), Type of Diabetes=Other Type)
|
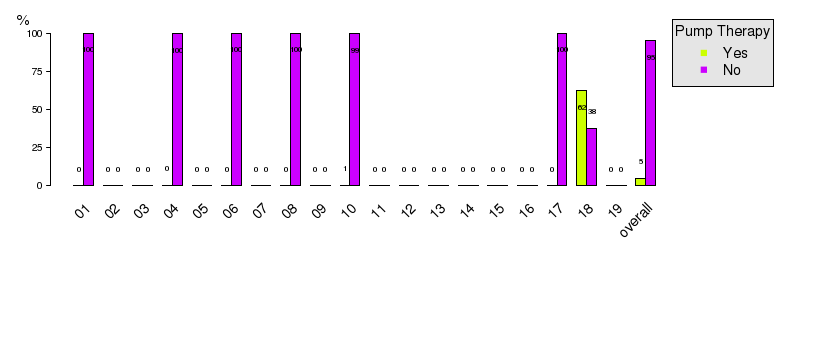
Barplot 3.3.4.4.5.10c - Pump Therapy (by Data Source, Age Classes = [25 - 50), Type of Diabetes=Other Type)
|
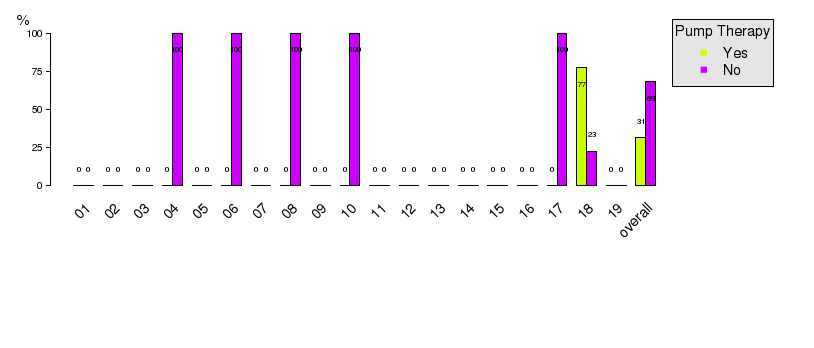
Barplot 3.3.4.4.5.10d - Pump Therapy (by Data Source, Age Classes = [50 - 65), Type of Diabetes=Other Type)

|
Barplot 3.3.4.4.5.10e - Pump Therapy (by Data Source, Age Classes = [65 - 80), Type of Diabetes=Other Type)

|
Barplot 3.3.4.4.5.10f - Pump Therapy (by Data Source, Age Classes = >=80, Type of Diabetes=Other Type)
