| Instab |
Valid Value (%) |
NV/NA (%) |
|
| Valid Value |
117864 ( 82.1) |
0 ( 0.0) |
117864 ( 82.1) |
| NV/NA |
25776 ( 17.9) |
0 ( 0.0) |
25776 ( 17.9) |
|
143640 (100.0) |
0 ( 0.0) |
143640 (100.0) |
Table 3.3.4.4.4.1 : Instab (by Type of Diabetes)
| CMH Chi-Square |
p.value |
df |
| 59037.8707 |
0 |
1 |

|
Barplot 3.3.4.4.4.1 - Instab (by Type of Diabetes)
| Instab |
Type 1 (%) |
Type 2 (%) |
Other Type (%) |
|
| Yes |
498 ( 4.5) |
16014 ( 15.3) |
334 ( 18.1) |
16846 ( 14.3) |
| No |
10543 ( 95.5) |
88965 ( 84.7) |
1510 ( 81.9) |
101018 ( 85.7) |
|
11041 ( 9.4) |
104979 ( 89.1) |
1844 ( 1.6) |
117864 (100.0) |
Table 3.3.4.4.4.2 : Instab (by Type of Diabetes)
| CMH Chi-Square |
p.value |
df |
| 963.7247 |
0 |
2 |

|
Barplot 3.3.4.4.4.2 - Instab (by Type of Diabetes)
|
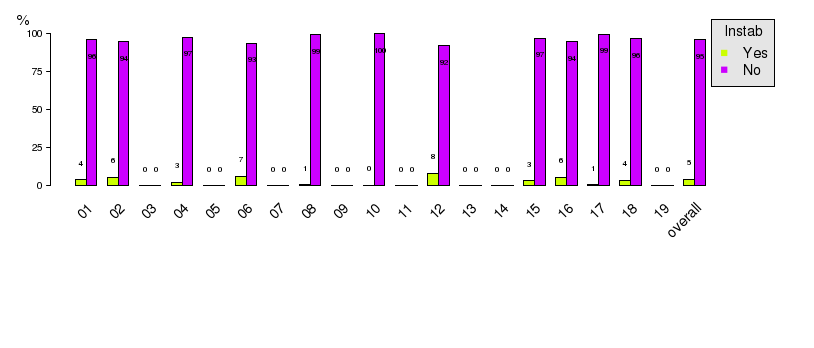
Barplot 3.3.4.4.4.2a - Instab (by Data Source, Type of Diabetes = Type 1)

|
Barplot 3.3.4.4.4.2b - Instab (by Data Source, Type of Diabetes = Type 2)

|
Barplot 3.3.4.4.4.2c - Instab (by Data Source, Type of Diabetes = Other Type)
| Instab |
Valid Value (%) |
NV/NA (%) |
|
| Valid Value |
117864 ( 82.1) |
0 ( 0.0) |
117864 ( 82.1) |
| NV/NA |
25776 ( 17.9) |
0 ( 0.0) |
25776 ( 17.9) |
|
143640 (100.0) |
0 ( 0.0) |
143640 (100.0) |
Table 3.3.4.4.4.3 : Instab (by Age Classes)
| CMH Chi-Square |
p.value |
df |
| 59037.8707 |
0 |
1 |

|
Barplot 3.3.4.4.4.3 - Instab (by Age Classes)
| Instab |
<15 (%) |
[15 - 25) (%) |
[25 - 50) (%) |
[50 - 65) (%) |
[65 - 80) (%) |
>=80 (%) |
|
| Yes |
0 ( 0.0) |
29 ( 1.9) |
1288 ( 9.8) |
6244 ( 16.0) |
7699 ( 15.3) |
1586 ( 12.1) |
16846 ( 14.3) |
| No |
512 (100.0) |
1472 ( 98.1) |
11822 ( 90.2) |
32860 ( 84.0) |
42783 ( 84.7) |
11569 ( 87.9) |
101018 ( 85.7) |
|
512 ( 0.4) |
1501 ( 1.3) |
13110 ( 11.1) |
39104 ( 33.2) |
50482 ( 42.8) |
13155 ( 11.2) |
117864 (100.0) |
Table 3.3.4.4.4.4 : Instab (by Age Classes)
| CMH Chi-Square |
p.value |
df |
| 667.3661 |
0 |
5 |

|
Barplot 3.3.4.4.4.4 - Instab (by Age Classes)

|
Barplot 3.3.4.4.4.4a - Instab (by Data Source, Age Classes = <15)

|
Barplot 3.3.4.4.4.4b - Instab (by Data Source, Age Classes = [15 - 25))

|
Barplot 3.3.4.4.4.4c - Instab (by Data Source, Age Classes = [25 - 50))

|
Barplot 3.3.4.4.4.4d - Instab (by Data Source, Age Classes = [50 - 65))

|
Barplot 3.3.4.4.4.4e - Instab (by Data Source, Age Classes = [65 - 80))

|
Barplot 3.3.4.4.4.4f - Instab (by Data Source, Age Classes = >=80)
| Instab |
Age Classes |
|
| Valid Value (%) |
NV/NA (%) |
|
| Valid Value |
11041 ( 83.2) |
0 ( 0.0) |
11041 ( 83.2) |
| NV/NA |
2233 ( 16.8) |
0 ( 0.0) |
2233 ( 16.8) |
|
13274 (100.0) |
0 ( 0.0) |
13274 (100.0) |
Table 3.3.4.4.4.5 : Instab (by Age Classes, Type of Diabetes = Type 1)
| CMH Chi-Square |
p.value |
df |
| 5844.5732 |
0 |
1 |

|
Barplot 3.3.4.4.4.5 - Instab (by Age Classes, Type of Diabetes = Type 1)
| Instab |
Age Classes |
|
| <15 (%) |
[15 - 25) (%) |
[25 - 50) (%) |
[50 - 65) (%) |
[65 - 80) (%) |
>=80 (%) |
|
| Yes |
0 ( 0.0) |
15 ( 1.1) |
210 ( 4.1) |
174 ( 6.5) |
91 ( 7.9) |
8 ( 4.2) |
498 ( 4.5) |
| No |
500 (100.0) |
1371 ( 98.9) |
4925 ( 95.9) |
2501 ( 93.5) |
1065 ( 92.1) |
181 ( 95.8) |
10543 ( 95.5) |
|
500 ( 4.5) |
1386 ( 12.6) |
5135 ( 46.5) |
2675 ( 24.2) |
1156 ( 10.5) |
189 ( 1.7) |
11041 (100.0) |
Table 3.3.4.4.4.6 : Instab (by Age Classes, Type of Diabetes = Type 1)
| CMH Chi-Square |
p.value |
df |
| 118.6113 |
0 |
5 |

|
Barplot 3.3.4.4.4.6 - Instab (by Age Classes, Type of Diabetes = Type 1)

|
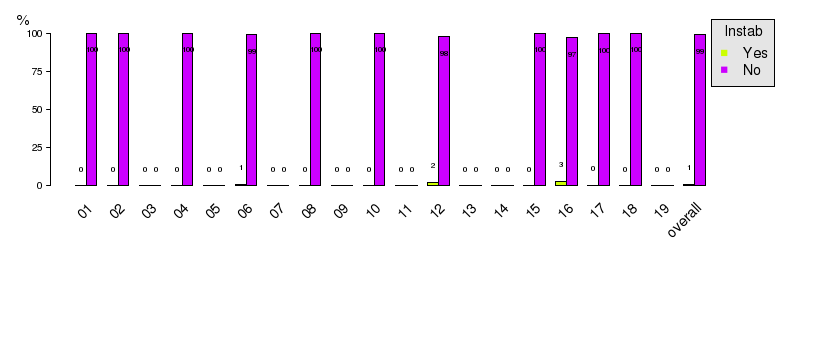
Barplot 3.3.4.4.4.6a - Instab (by Data Source, Age Classes = <15, Type of Diabetes=Type 1)
|
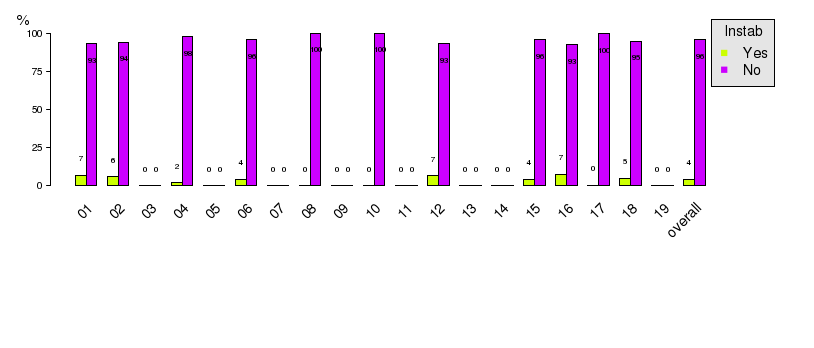
Barplot 3.3.4.4.4.6b - Instab (by Data Source, Age Classes = [15 - 25), Type of Diabetes=Type 1)
|
Barplot 3.3.4.4.4.6c - Instab (by Data Source, Age Classes = [25 - 50), Type of Diabetes=Type 1)

|
Barplot 3.3.4.4.4.6d - Instab (by Data Source, Age Classes = [50 - 65), Type of Diabetes=Type 1)

|
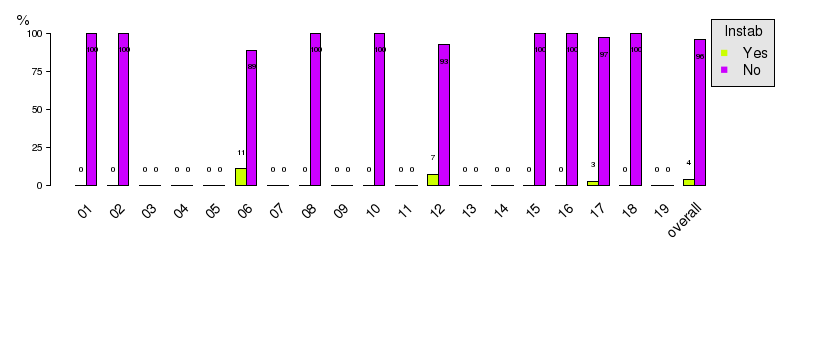
Barplot 3.3.4.4.4.6e - Instab (by Data Source, Age Classes = [65 - 80), Type of Diabetes=Type 1)
|
Barplot 3.3.4.4.4.6f - Instab (by Data Source, Age Classes = >=80, Type of Diabetes=Type 1)
| Instab |
Age Classes |
|
| Valid Value (%) |
NV/NA (%) |
|
| Valid Value |
104979 ( 82.0) |
0 ( 0.0) |
104979 ( 82.0) |
| NV/NA |
23049 ( 18.0) |
0 ( 0.0) |
23049 ( 18.0) |
|
128028 (100.0) |
0 ( 0.0) |
128028 (100.0) |
Table 3.3.4.4.4.7 : Instab (by Age Classes, Type of Diabetes = Type 2)
| CMH Chi-Square |
p.value |
df |
| 52430.1317 |
0 |
1 |

|
Barplot 3.3.4.4.4.7 - Instab (by Age Classes, Type of Diabetes = Type 2)
| Instab |
Age Classes |
|
| <15 (%) |
[15 - 25) (%) |
[25 - 50) (%) |
[50 - 65) (%) |
[65 - 80) (%) |
>=80 (%) |
|
| Yes |
0 ( 0.0) |
13 ( 16.7) |
1040 ( 13.8) |
5946 ( 16.6) |
7479 ( 15.3) |
1536 ( 12.0) |
16014 ( 15.3) |
| No |
9 (100.0) |
65 ( 83.3) |
6499 ( 86.2) |
29853 ( 83.4) |
41269 ( 84.7) |
11270 ( 88.0) |
88965 ( 84.7) |
|
9 ( 0.0) |
78 ( 0.1) |
7539 ( 7.2) |
35799 ( 34.1) |
48748 ( 46.4) |
12806 ( 12.2) |
104979 (100.0) |
Table 3.3.4.4.4.8 : Instab (by Age Classes, Type of Diabetes = Type 2)
| CMH Chi-Square |
p.value |
df |
| 170.5751 |
0 |
5 |

|
Barplot 3.3.4.4.4.8 - Instab (by Age Classes, Type of Diabetes = Type 2)

|
Barplot 3.3.4.4.4.8a - Instab (by Data Source, Age Classes = <15, Type of Diabetes=Type 2)

|
Barplot 3.3.4.4.4.8b - Instab (by Data Source, Age Classes = [15 - 25), Type of Diabetes=Type 2)

|
Barplot 3.3.4.4.4.8c - Instab (by Data Source, Age Classes = [25 - 50), Type of Diabetes=Type 2)

|
Barplot 3.3.4.4.4.8d - Instab (by Data Source, Age Classes = [50 - 65), Type of Diabetes=Type 2)

|
Barplot 3.3.4.4.4.8e - Instab (by Data Source, Age Classes = [65 - 80), Type of Diabetes=Type 2)

|
Barplot 3.3.4.4.4.8f - Instab (by Data Source, Age Classes = >=80, Type of Diabetes=Type 2)
| Instab |
Age Classes |
|
| Valid Value (%) |
NV/NA (%) |
|
| Valid Value |
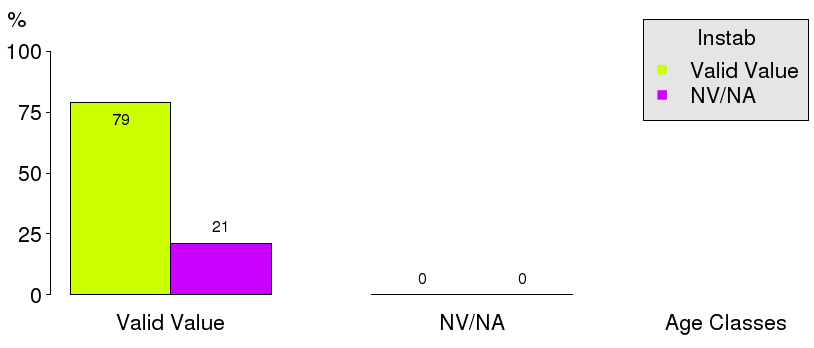
1844 ( 78.9) |
0 ( 0.0) |
1844 ( 78.9) |
| NV/NA |
494 ( 21.1) |
0 ( 0.0) |
494 ( 21.1) |
|
2338 (100.0) |
0 ( 0.0) |
2338 (100.0) |
Table 3.3.4.4.4.9 : Instab (by Age Classes, Type of Diabetes = Other Type)
| CMH Chi-Square |
p.value |
df |
| 779.5124 |
0 |
1 |
|
Barplot 3.3.4.4.4.9 - Instab (by Age Classes, Type of Diabetes = Other Type)
| Instab |
Age Classes |
|
| <15 (%) |
[15 - 25) (%) |
[25 - 50) (%) |
[50 - 65) (%) |
[65 - 80) (%) |
>=80 (%) |
|
| Yes |
0 ( 0.0) |
1 ( 2.7) |
38 ( 8.7) |
124 ( 19.7) |
129 ( 22.3) |
42 ( 26.2) |
334 ( 18.1) |
| No |
3 (100.0) |
36 ( 97.3) |
398 ( 91.3) |
506 ( 80.3) |
449 ( 77.7) |
118 ( 73.8) |
1510 ( 81.9) |
|
3 ( 0.2) |
37 ( 2.0) |
436 ( 23.6) |
630 ( 34.2) |
578 ( 31.3) |
160 ( 8.7) |
1844 (100.0) |
Table 3.3.4.4.4.10 : Instab (by Age Classes, Type of Diabetes = Other Type)
| CMH Chi-Square |
p.value |
df |
| 47.628 |
0 |
5 |

|
Barplot 3.3.4.4.4.10 - Instab (by Age Classes, Type of Diabetes = Other Type)

|
Barplot 3.3.4.4.4.10a - Instab (by Data Source, Age Classes = <15, Type of Diabetes=Other Type)

|
Barplot 3.3.4.4.4.10b - Instab (by Data Source, Age Classes = [15 - 25), Type of Diabetes=Other Type)

|
Barplot 3.3.4.4.4.10c - Instab (by Data Source, Age Classes = [25 - 50), Type of Diabetes=Other Type)
|
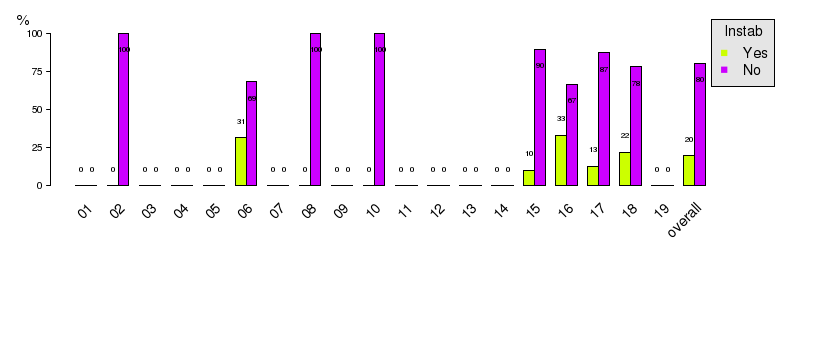
Barplot 3.3.4.4.4.10d - Instab (by Data Source, Age Classes = [50 - 65), Type of Diabetes=Other Type)

|
Barplot 3.3.4.4.4.10e - Instab (by Data Source, Age Classes = [65 - 80), Type of Diabetes=Other Type)

|
Barplot 3.3.4.4.4.10f - Instab (by Data Source, Age Classes = >=80, Type of Diabetes=Other Type)
