| Insulin Only |
Valid Value (%) |
NV/NA (%) |
|
| Valid Value |
145807 ( 80.7) |
0 ( 0.0) |
145807 ( 80.7) |
| NV/NA |
34912 ( 19.3) |
0 ( 0.0) |
34912 ( 19.3) |
|
180719 (100.0) |
0 ( 0.0) |
180719 (100.0) |
Table 3.3.4.4.3.1 : Insulin Only (by Type of Diabetes)
| CMH Chi-Square |
p.value |
df |
| 68048.7443 |
0 |
1 |

|
Barplot 3.3.4.4.3.1 - Insulin Only (by Type of Diabetes)
| Insulin Only |
Type 1 (%) |
Type 2 (%) |
Other Type (%) |
|
| Yes |
13922 ( 91.8) |
26537 ( 20.7) |
1110 ( 47.1) |
41569 ( 28.5) |
| No |
1246 ( 8.2) |
101744 ( 79.3) |
1248 ( 52.9) |
104238 ( 71.5) |
|
15168 ( 10.4) |
128281 ( 88.0) |
2358 ( 1.6) |
145807 (100.0) |
Table 3.3.4.4.3.2 : Insulin Only (by Type of Diabetes)
| CMH Chi-Square |
p.value |
df |
| 34046.9529 |
0 |
2 |

|
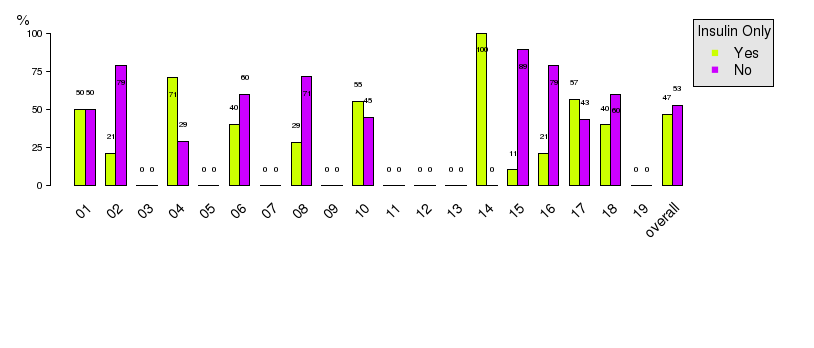
Barplot 3.3.4.4.3.2 - Insulin Only (by Type of Diabetes)

|
Barplot 3.3.4.4.3.2a - Insulin Only (by Data Source, Type of Diabetes = Type 1)

|
Barplot 3.3.4.4.3.2b - Insulin Only (by Data Source, Type of Diabetes = Type 2)
|
Barplot 3.3.4.4.3.2c - Insulin Only (by Data Source, Type of Diabetes = Other Type)
| Insulin Only |
Valid Value (%) |
NV/NA (%) |
|
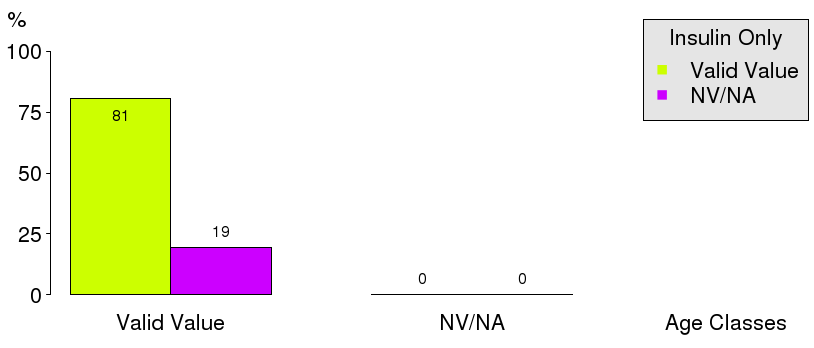
| Valid Value |
145807 ( 80.7) |
0 ( 0.0) |
145807 ( 80.7) |
| NV/NA |
34912 ( 19.3) |
0 ( 0.0) |
34912 ( 19.3) |
|
180719 (100.0) |
0 ( 0.0) |
180719 (100.0) |
Table 3.3.4.4.3.3 : Insulin Only (by Age Classes)
| CMH Chi-Square |
p.value |
df |
| 68048.7443 |
0 |
1 |
|
Barplot 3.3.4.4.3.3 - Insulin Only (by Age Classes)
| Insulin Only |
<15 (%) |
[15 - 25) (%) |
[25 - 50) (%) |
[50 - 65) (%) |
[65 - 80) (%) |
>=80 (%) |
|
| Yes |
958 ( 96.2) |
2099 ( 92.5) |
8476 ( 51.5) |
10526 ( 22.6) |
14759 ( 23.5) |
4751 ( 28.3) |
41569 ( 28.5) |
| No |
38 ( 3.8) |
170 ( 7.5) |
7983 ( 48.5) |
36040 ( 77.4) |
47976 ( 76.5) |
12031 ( 71.7) |
104238 ( 71.5) |
|
996 ( 0.7) |
2269 ( 1.6) |
16459 ( 11.3) |
46566 ( 31.9) |
62735 ( 43.0) |
16782 ( 11.5) |
145807 (100.0) |
Table 3.3.4.4.3.4 : Insulin Only (by Age Classes)
| CMH Chi-Square |
p.value |
df |
| 12626.6851 |
0 |
5 |

|
Barplot 3.3.4.4.3.4 - Insulin Only (by Age Classes)

|
Barplot 3.3.4.4.3.4a - Insulin Only (by Data Source, Age Classes = <15)

|
Barplot 3.3.4.4.3.4b - Insulin Only (by Data Source, Age Classes = [15 - 25))

|
Barplot 3.3.4.4.3.4c - Insulin Only (by Data Source, Age Classes = [25 - 50))

|
Barplot 3.3.4.4.3.4d - Insulin Only (by Data Source, Age Classes = [50 - 65))

|
Barplot 3.3.4.4.3.4e - Insulin Only (by Data Source, Age Classes = [65 - 80))

|
Barplot 3.3.4.4.3.4f - Insulin Only (by Data Source, Age Classes = >=80)
| Insulin Only |
Age Classes |
|
| Valid Value (%) |
NV/NA (%) |
|
| Valid Value |
15168 ( 85.5) |
0 ( 0.0) |
15168 ( 85.5) |
| NV/NA |
2565 ( 14.5) |
0 ( 0.0) |
2565 ( 14.5) |
|
17733 (100.0) |
0 ( 0.0) |
17733 (100.0) |
Table 3.3.4.4.3.5 : Insulin Only (by Age Classes, Type of Diabetes = Type 1)
| CMH Chi-Square |
p.value |
df |
| 8957.0636 |
0 |
1 |

|
Barplot 3.3.4.4.3.5 - Insulin Only (by Age Classes, Type of Diabetes = Type 1)
| Insulin Only |
Age Classes |
|
| <15 (%) |
[15 - 25) (%) |
[25 - 50) (%) |
[50 - 65) (%) |
[65 - 80) (%) |
>=80 (%) |
|
| Yes |
950 ( 96.9) |
2061 ( 96.5) |
6503 ( 93.2) |
3005 ( 88.4) |
1219 ( 83.4) |
184 ( 85.6) |
13922 ( 91.8) |
| No |
30 ( 3.1) |
74 ( 3.5) |
475 ( 6.8) |
393 ( 11.6) |
243 ( 16.6) |
31 ( 14.4) |
1246 ( 8.2) |
|
980 ( 6.5) |
2135 ( 14.1) |
6978 ( 46.0) |
3398 ( 22.4) |
1462 ( 9.6) |
215 ( 1.4) |
15168 (100.0) |
Table 3.3.4.4.3.6 : Insulin Only (by Age Classes, Type of Diabetes = Type 1)
| CMH Chi-Square |
p.value |
df |
| 315.3135 |
0 |
5 |

|
Barplot 3.3.4.4.3.6 - Insulin Only (by Age Classes, Type of Diabetes = Type 1)

|
Barplot 3.3.4.4.3.6a - Insulin Only (by Data Source, Age Classes = <15, Type of Diabetes=Type 1)

|
Barplot 3.3.4.4.3.6b - Insulin Only (by Data Source, Age Classes = [15 - 25), Type of Diabetes=Type 1)

|
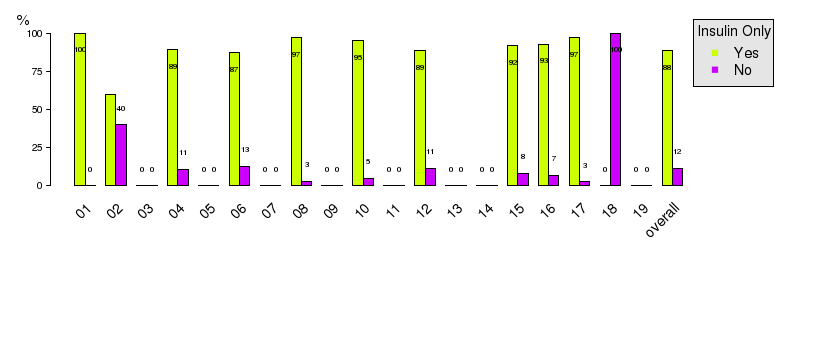
Barplot 3.3.4.4.3.6c - Insulin Only (by Data Source, Age Classes = [25 - 50), Type of Diabetes=Type 1)
|
Barplot 3.3.4.4.3.6d - Insulin Only (by Data Source, Age Classes = [50 - 65), Type of Diabetes=Type 1)

|
Barplot 3.3.4.4.3.6e - Insulin Only (by Data Source, Age Classes = [65 - 80), Type of Diabetes=Type 1)

|
Barplot 3.3.4.4.3.6f - Insulin Only (by Data Source, Age Classes = >=80, Type of Diabetes=Type 1)
| Insulin Only |
Age Classes |
|
| Valid Value (%) |
NV/NA (%) |
|
| Valid Value |
128281 ( 80.3) |
0 ( 0.0) |
128281 ( 80.3) |
| NV/NA |
31407 ( 19.7) |
0 ( 0.0) |
31407 ( 19.7) |
|
159688 (100.0) |
0 ( 0.0) |
159688 (100.0) |
Table 3.3.4.4.3.7 : Insulin Only (by Age Classes, Type of Diabetes = Type 2)
| CMH Chi-Square |
p.value |
df |
| 58768.1722 |
0 |
1 |

|
Barplot 3.3.4.4.3.7 - Insulin Only (by Age Classes, Type of Diabetes = Type 2)
| Insulin Only |
Age Classes |
|
| <15 (%) |
[15 - 25) (%) |
[25 - 50) (%) |
[50 - 65) (%) |
[65 - 80) (%) |
>=80 (%) |
|
| Yes |
4 ( 36.4) |
18 ( 20.5) |
1569 ( 17.8) |
7173 ( 16.9) |
13261 ( 21.9) |
4512 ( 27.5) |
26537 ( 20.7) |
| No |
7 ( 63.6) |
70 ( 79.5) |
7248 ( 82.2) |
35241 ( 83.1) |
47300 ( 78.1) |
11878 ( 72.5) |
101744 ( 79.3) |
|
11 ( 0.0) |
88 ( 0.1) |
8817 ( 6.9) |
42414 ( 33.1) |
60561 ( 47.2) |
16390 ( 12.8) |
128281 (100.0) |
Table 3.3.4.4.3.8 : Insulin Only (by Age Classes, Type of Diabetes = Type 2)
| CMH Chi-Square |
p.value |
df |
| 936.6754 |
0 |
5 |

|
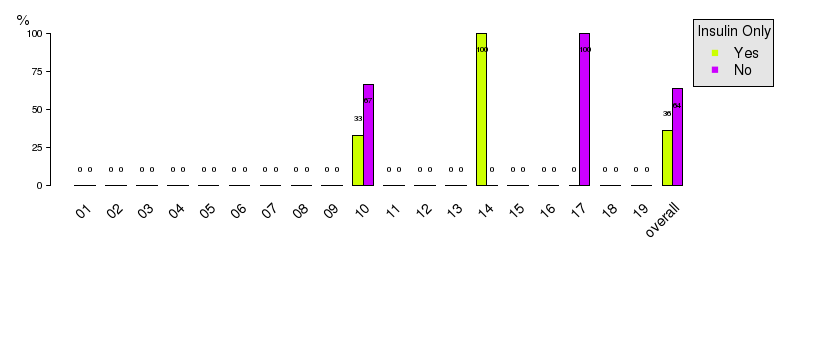
Barplot 3.3.4.4.3.8 - Insulin Only (by Age Classes, Type of Diabetes = Type 2)
|
Barplot 3.3.4.4.3.8a - Insulin Only (by Data Source, Age Classes = <15, Type of Diabetes=Type 2)

|
Barplot 3.3.4.4.3.8b - Insulin Only (by Data Source, Age Classes = [15 - 25), Type of Diabetes=Type 2)

|
Barplot 3.3.4.4.3.8c - Insulin Only (by Data Source, Age Classes = [25 - 50), Type of Diabetes=Type 2)

|
Barplot 3.3.4.4.3.8d - Insulin Only (by Data Source, Age Classes = [50 - 65), Type of Diabetes=Type 2)
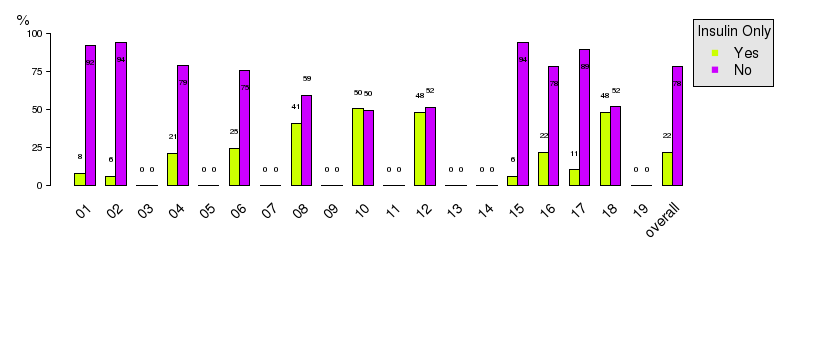
|
Barplot 3.3.4.4.3.8e - Insulin Only (by Data Source, Age Classes = [65 - 80), Type of Diabetes=Type 2)

|
Barplot 3.3.4.4.3.8f - Insulin Only (by Data Source, Age Classes = >=80, Type of Diabetes=Type 2)
| Insulin Only |
Age Classes |
|
| Valid Value (%) |
NV/NA (%) |
|
| Valid Value |
2358 ( 71.5) |
0 ( 0.0) |
2358 ( 71.5) |
| NV/NA |
940 ( 28.5) |
0 ( 0.0) |
940 ( 28.5) |
|
3298 (100.0) |
0 ( 0.0) |
3298 (100.0) |
Table 3.3.4.4.3.9 : Insulin Only (by Age Classes, Type of Diabetes = Other Type)
| CMH Chi-Square |
p.value |
df |
| 609.6798 |
0 |
1 |

|
Barplot 3.3.4.4.3.9 - Insulin Only (by Age Classes, Type of Diabetes = Other Type)
| Insulin Only |
Age Classes |
|
| <15 (%) |
[15 - 25) (%) |
[25 - 50) (%) |
[50 - 65) (%) |
[65 - 80) (%) |
>=80 (%) |
|
| Yes |
4 ( 80.0) |
20 ( 43.5) |
404 ( 60.8) |
348 ( 46.2) |
279 ( 39.2) |
55 ( 31.1) |
1110 ( 47.1) |
| No |
1 ( 20.0) |
26 ( 56.5) |
260 ( 39.2) |
406 ( 53.8) |
433 ( 60.8) |
122 ( 68.9) |
1248 ( 52.9) |
|
5 ( 0.2) |
46 ( 2.0) |
664 ( 28.2) |
754 ( 32.0) |
712 ( 30.2) |
177 ( 7.5) |
2358 (100.0) |
Table 3.3.4.4.3.10 : Insulin Only (by Age Classes, Type of Diabetes = Other Type)
| CMH Chi-Square |
p.value |
df |
| 89.1727 |
0 |
5 |

|
Barplot 3.3.4.4.3.10 - Insulin Only (by Age Classes, Type of Diabetes = Other Type)
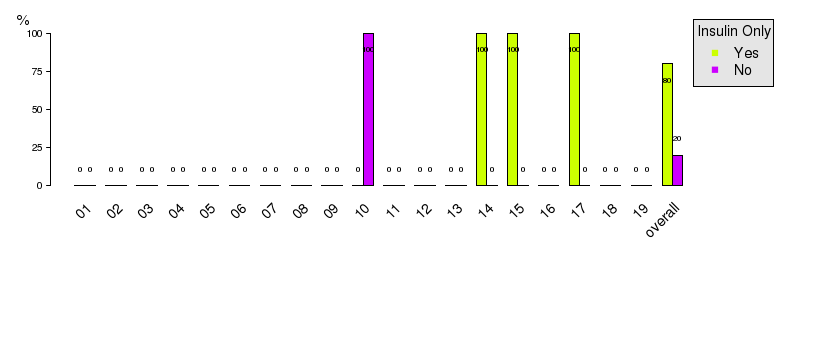
|
Barplot 3.3.4.4.3.10a - Insulin Only (by Data Source, Age Classes = <15, Type of Diabetes=Other Type)

|
Barplot 3.3.4.4.3.10b - Insulin Only (by Data Source, Age Classes = [15 - 25), Type of Diabetes=Other Type)

|
Barplot 3.3.4.4.3.10c - Insulin Only (by Data Source, Age Classes = [25 - 50), Type of Diabetes=Other Type)

|
Barplot 3.3.4.4.3.10d - Insulin Only (by Data Source, Age Classes = [50 - 65), Type of Diabetes=Other Type)

|
Barplot 3.3.4.4.3.10e - Insulin Only (by Data Source, Age Classes = [65 - 80), Type of Diabetes=Other Type)

|
Barplot 3.3.4.4.3.10f - Insulin Only (by Data Source, Age Classes = >=80, Type of Diabetes=Other Type)
