| Lipid Lowering Med |
Valid Value (%) |
NV/NA (%) |
|
| Valid Value |
136670 ( 83.4) |
0 ( 0.0) |
136670 ( 83.4) |
| NV/NA |
27170 ( 16.6) |
0 ( 0.0) |
27170 ( 16.6) |
|
163840 (100.0) |
0 ( 0.0) |
163840 (100.0) |
Table 3.3.4.2.1 : Lipid Lowering Med (by Type of Diabetes)
| CMH Chi-Square |
p.value |
df |
| 73182.6782 |
0 |
1 |

|
Barplot 3.3.4.2.1 - Lipid Lowering Med (by Type of Diabetes)
| Lipid Lowering Med |
Type 1 (%) |
Type 2 (%) |
Other Type (%) |
|
| Yes |
3311 ( 25.0) |
57675 ( 47.6) |
515 ( 22.2) |
61501 ( 45.0) |
| No |
9926 ( 75.0) |
63443 ( 52.4) |
1800 ( 77.8) |
75169 ( 55.0) |
|
13237 ( 9.7) |
121118 ( 88.6) |
2315 ( 1.7) |
136670 (100.0) |
Table 3.3.4.2.2 : Lipid Lowering Med (by Type of Diabetes)
| CMH Chi-Square |
p.value |
df |
| 2956.3805 |
0 |
2 |

|
Barplot 3.3.4.2.2 - Lipid Lowering Med (by Type of Diabetes)

|
Barplot 3.3.4.2.2a - Lipid Lowering Med (by Data Source, Type of Diabetes = Type 1)

|
Barplot 3.3.4.2.2b - Lipid Lowering Med (by Data Source, Type of Diabetes = Type 2)

|
Barplot 3.3.4.2.2c - Lipid Lowering Med (by Data Source, Type of Diabetes = Other Type)
| Lipid Lowering Med |
Valid Value (%) |
NV/NA (%) |
|
| Valid Value |
136670 ( 83.4) |
0 ( 0.0) |
136670 ( 83.4) |
| NV/NA |
27170 ( 16.6) |
0 ( 0.0) |
27170 ( 16.6) |
|
163840 (100.0) |
0 ( 0.0) |
163840 (100.0) |
Table 3.3.4.2.3 : Lipid Lowering Med (by Age Classes)
| CMH Chi-Square |
p.value |
df |
| 73182.6782 |
0 |
1 |

|
Barplot 3.3.4.2.3 - Lipid Lowering Med (by Age Classes)
| Lipid Lowering Med |
<15 (%) |
[15 - 25) (%) |
[25 - 50) (%) |
[50 - 65) (%) |
[65 - 80) (%) |
>=80 (%) |
|
| Yes |
8 ( 1.4) |
64 ( 3.8) |
3994 ( 26.2) |
20490 ( 48.0) |
29987 ( 50.2) |
6958 ( 41.5) |
61501 ( 45.0) |
| No |
571 ( 98.6) |
1600 ( 96.2) |
11270 ( 73.8) |
22169 ( 52.0) |
29769 ( 49.8) |
9790 ( 58.5) |
75169 ( 55.0) |
|
579 ( 0.4) |
1664 ( 1.2) |
15264 ( 11.2) |
42659 ( 31.2) |
59756 ( 43.7) |
16748 ( 12.3) |
136670 (100.0) |
Table 3.3.4.2.4 : Lipid Lowering Med (by Age Classes)
| CMH Chi-Square |
p.value |
df |
| 4659.0434 |
0 |
5 |

|
Barplot 3.3.4.2.4 - Lipid Lowering Med (by Age Classes)

|
Barplot 3.3.4.2.4a - Lipid Lowering Med (by Data Source, Age Classes = <15)

|
Barplot 3.3.4.2.4b - Lipid Lowering Med (by Data Source, Age Classes = [15 - 25))

|
Barplot 3.3.4.2.4c - Lipid Lowering Med (by Data Source, Age Classes = [25 - 50))

|
Barplot 3.3.4.2.4d - Lipid Lowering Med (by Data Source, Age Classes = [50 - 65))

|
Barplot 3.3.4.2.4e - Lipid Lowering Med (by Data Source, Age Classes = [65 - 80))

|
Barplot 3.3.4.2.4f - Lipid Lowering Med (by Data Source, Age Classes = >=80)
| Lipid Lowering Med |
Age Classes |
|
| Valid Value (%) |
NV/NA (%) |
|
| Valid Value |
13237 ( 79.8) |
0 ( 0.0) |
13237 ( 79.8) |
| NV/NA |
3353 ( 20.2) |
0 ( 0.0) |
3353 ( 20.2) |
|
16590 (100.0) |
0 ( 0.0) |
16590 (100.0) |
Table 3.3.4.2.5 : Lipid Lowering Med (by Age Classes, Type of Diabetes = Type 1)
| CMH Chi-Square |
p.value |
df |
| 5888.6954 |
0 |
1 |

|
Barplot 3.3.4.2.5 - Lipid Lowering Med (by Age Classes, Type of Diabetes = Type 1)
| Lipid Lowering Med |
Age Classes |
|
| <15 (%) |
[15 - 25) (%) |
[25 - 50) (%) |
[50 - 65) (%) |
[65 - 80) (%) |
>=80 (%) |
|
| Yes |
4 ( 0.7) |
47 ( 3.1) |
1105 ( 17.3) |
1368 ( 42.9) |
698 ( 51.1) |
89 ( 46.6) |
3311 ( 25.0) |
| No |
559 ( 99.3) |
1479 ( 96.9) |
5296 ( 82.7) |
1823 ( 57.1) |
667 ( 48.9) |
102 ( 53.4) |
9926 ( 75.0) |
|
563 ( 4.3) |
1526 ( 11.5) |
6401 ( 48.4) |
3191 ( 24.1) |
1365 ( 10.3) |
191 ( 1.4) |
13237 (100.0) |
Table 3.3.4.2.6 : Lipid Lowering Med (by Age Classes, Type of Diabetes = Type 1)
| CMH Chi-Square |
p.value |
df |
| 1860.1991 |
0 |
5 |

|
Barplot 3.3.4.2.6 - Lipid Lowering Med (by Age Classes, Type of Diabetes = Type 1)

|
Barplot 3.3.4.2.6a - Lipid Lowering Med (by Data Source, Age Classes = <15, Type of Diabetes=Type 1)

|
Barplot 3.3.4.2.6b - Lipid Lowering Med (by Data Source, Age Classes = [15 - 25), Type of Diabetes=Type 1)

|
Barplot 3.3.4.2.6c - Lipid Lowering Med (by Data Source, Age Classes = [25 - 50), Type of Diabetes=Type 1)

|
Barplot 3.3.4.2.6d - Lipid Lowering Med (by Data Source, Age Classes = [50 - 65), Type of Diabetes=Type 1)

|
Barplot 3.3.4.2.6e - Lipid Lowering Med (by Data Source, Age Classes = [65 - 80), Type of Diabetes=Type 1)

|
Barplot 3.3.4.2.6f - Lipid Lowering Med (by Data Source, Age Classes = >=80, Type of Diabetes=Type 1)
| Lipid Lowering Med |
Age Classes |
|
| Valid Value (%) |
NV/NA (%) |
|
| Valid Value |
121118 ( 83.9) |
0 ( 0.0) |
121118 ( 83.9) |
| NV/NA |
23294 ( 16.1) |
0 ( 0.0) |
23294 ( 16.1) |
|
144412 (100.0) |
0 ( 0.0) |
144412 (100.0) |
Table 3.3.4.2.7 : Lipid Lowering Med (by Age Classes, Type of Diabetes = Type 2)
| CMH Chi-Square |
p.value |
df |
| 66265.511 |
0 |
1 |

|
Barplot 3.3.4.2.7 - Lipid Lowering Med (by Age Classes, Type of Diabetes = Type 2)
| Lipid Lowering Med |
Age Classes |
|
| <15 (%) |
[15 - 25) (%) |
[25 - 50) (%) |
[50 - 65) (%) |
[65 - 80) (%) |
>=80 (%) |
|
| Yes |
4 ( 36.4) |
14 ( 17.7) |
2840 ( 35.7) |
18923 ( 48.7) |
29064 ( 50.3) |
6830 ( 41.7) |
57675 ( 47.6) |
| No |
7 ( 63.6) |
65 ( 82.3) |
5115 ( 64.3) |
19957 ( 51.3) |
28731 ( 49.7) |
9568 ( 58.3) |
63443 ( 52.4) |
|
11 ( 0.0) |
79 ( 0.1) |
7955 ( 6.6) |
38880 ( 32.1) |
57795 ( 47.7) |
16398 ( 13.5) |
121118 (100.0) |
Table 3.3.4.2.8 : Lipid Lowering Med (by Age Classes, Type of Diabetes = Type 2)
| CMH Chi-Square |
p.value |
df |
| 898.2887 |
0 |
5 |

|
Barplot 3.3.4.2.8 - Lipid Lowering Med (by Age Classes, Type of Diabetes = Type 2)

|
Barplot 3.3.4.2.8a - Lipid Lowering Med (by Data Source, Age Classes = <15, Type of Diabetes=Type 2)

|
Barplot 3.3.4.2.8b - Lipid Lowering Med (by Data Source, Age Classes = [15 - 25), Type of Diabetes=Type 2)

|
Barplot 3.3.4.2.8c - Lipid Lowering Med (by Data Source, Age Classes = [25 - 50), Type of Diabetes=Type 2)
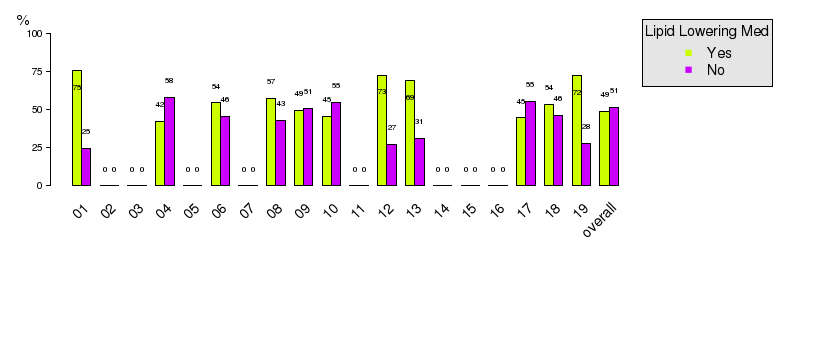
|
Barplot 3.3.4.2.8d - Lipid Lowering Med (by Data Source, Age Classes = [50 - 65), Type of Diabetes=Type 2)

|
Barplot 3.3.4.2.8e - Lipid Lowering Med (by Data Source, Age Classes = [65 - 80), Type of Diabetes=Type 2)

|
Barplot 3.3.4.2.8f - Lipid Lowering Med (by Data Source, Age Classes = >=80, Type of Diabetes=Type 2)
| Lipid Lowering Med |
Age Classes |
|
| Valid Value (%) |
NV/NA (%) |
|
| Valid Value |
2315 ( 81.6) |
0 ( 0.0) |
2315 ( 81.6) |
| NV/NA |
523 ( 18.4) |
0 ( 0.0) |
523 ( 18.4) |
|
2838 (100.0) |
0 ( 0.0) |
2838 (100.0) |
Table 3.3.4.2.9 : Lipid Lowering Med (by Age Classes, Type of Diabetes = Other Type)
| CMH Chi-Square |
p.value |
df |
| 1131.5236 |
0 |
1 |

|
Barplot 3.3.4.2.9 - Lipid Lowering Med (by Age Classes, Type of Diabetes = Other Type)
| Lipid Lowering Med |
Age Classes |
|
| <15 (%) |
[15 - 25) (%) |
[25 - 50) (%) |
[50 - 65) (%) |
[65 - 80) (%) |
>=80 (%) |
|
| Yes |
0 ( 0.0) |
3 ( 5.1) |
49 ( 5.4) |
199 ( 33.8) |
225 ( 37.8) |
39 ( 24.5) |
515 ( 22.2) |
| No |
5 (100.0) |
56 ( 94.9) |
859 ( 94.6) |
389 ( 66.2) |
371 ( 62.2) |
120 ( 75.5) |
1800 ( 77.8) |
|
5 ( 0.2) |
59 ( 2.5) |
908 ( 39.2) |
588 ( 25.4) |
596 ( 25.7) |
159 ( 6.9) |
2315 (100.0) |
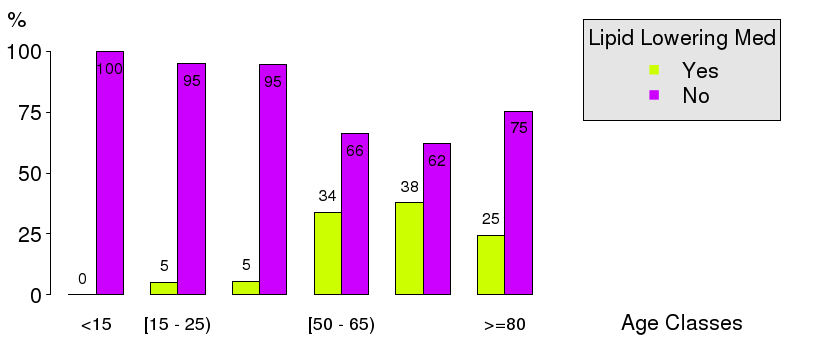
Table 3.3.4.2.10 : Lipid Lowering Med (by Age Classes, Type of Diabetes = Other Type)
| CMH Chi-Square |
p.value |
df |
| 289.5527 |
0 |
5 |
|
Barplot 3.3.4.2.10 - Lipid Lowering Med (by Age Classes, Type of Diabetes = Other Type)

|
Barplot 3.3.4.2.10a - Lipid Lowering Med (by Data Source, Age Classes = <15, Type of Diabetes=Other Type)

|
Barplot 3.3.4.2.10b - Lipid Lowering Med (by Data Source, Age Classes = [15 - 25), Type of Diabetes=Other Type)

|
Barplot 3.3.4.2.10c - Lipid Lowering Med (by Data Source, Age Classes = [25 - 50), Type of Diabetes=Other Type)

|
Barplot 3.3.4.2.10d - Lipid Lowering Med (by Data Source, Age Classes = [50 - 65), Type of Diabetes=Other Type)

|
Barplot 3.3.4.2.10e - Lipid Lowering Med (by Data Source, Age Classes = [65 - 80), Type of Diabetes=Other Type)

|
Barplot 3.3.4.2.10f - Lipid Lowering Med (by Data Source, Age Classes = >=80, Type of Diabetes=Other Type)
