
|
| BIRO Report site: 319761ea64b939fa1be95f0c7eb6e8c07691f006 |
| Reference date: 18/02/12 |
| Parameter: 3.3.3.1 BP (1+ measurements in 12 mts) |
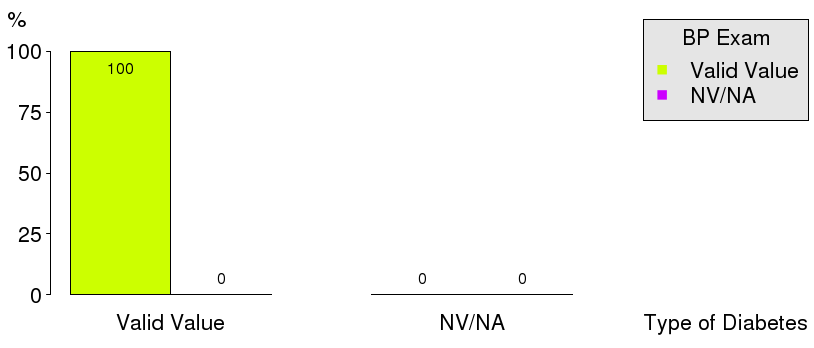
| BP Exam | Valid Value (%) | NV/NA (%) | |
|---|---|---|---|
| Valid Value | 199519 (100.0) | 0 ( 0.0) | 199519 (100.0) |
| NV/NA | 0 ( 0.0) | 0 ( 0.0) | 0 ( 0.0) |
| 199519 (100.0) | 0 ( 0.0) | 199519 (100.0) |
| CMH Chi-Square |
|---|
| Too many cells have 0 obs |
|
| BP Exam | Type 1 (%) | Type 2 (%) | Other Type (%) | |
|---|---|---|---|---|
| Yes | 16928 ( 82.9) | 150400 ( 85.8) | 2755 ( 71.2) | 170083 ( 85.2) |
| No | 3481 ( 17.1) | 24840 ( 14.2) | 1115 ( 28.8) | 29436 ( 14.8) |
| 20409 ( 10.2) | 175240 ( 87.8) | 3870 ( 1.9) | 199519 (100.0) |
| CMH Chi-Square | p.value | df |
|---|---|---|
| 740.8055 | 0 | 2 |

|

|

|

|
| BP Exam | Valid Value (%) | NV/NA (%) | |
|---|---|---|---|
| Valid Value | 199519 (100.0) | 0 ( 0.0) | 199519 (100.0) |
| NV/NA | 0 ( 0.0) | 0 ( 0.0) | 0 ( 0.0) |
| 199519 (100.0) | 0 ( 0.0) | 199519 (100.0) |
| CMH Chi-Square |
|---|
| Too many cells have 0 obs |

|
| BP Exam | <15 (%) | [15 - 25) (%) | [25 - 50) (%) | [50 - 65) (%) | [65 - 80) (%) | >=80 (%) | |
|---|---|---|---|---|---|---|---|
| Yes | 681 ( 58.9) | 2483 ( 79.4) | 19980 ( 82.7) | 54991 ( 85.9) | 72446 ( 86.4) | 19502 ( 84.2) | 170083 ( 85.2) |
| No | 476 ( 41.1) | 643 ( 20.6) | 4181 ( 17.3) | 9061 ( 14.1) | 11414 ( 13.6) | 3661 ( 15.8) | 29436 ( 14.8) |
| 1157 ( 0.6) | 3126 ( 1.6) | 24161 ( 12.1) | 64052 ( 32.1) | 83860 ( 42.0) | 23163 ( 11.6) | 199519 (100.0) |
| CMH Chi-Square | p.value | df |
|---|---|---|
| 975.8876 | 0 | 5 |

|

|

|

|

|

|

|
| BP Exam | Age Classes | ||
|---|---|---|---|
| Valid Value (%) | NV/NA (%) | ||
| Valid Value | 20409 (100.0) | 0 ( 0.0) | 20409 (100.0) |
| NV/NA | 0 ( 0.0) | 0 ( 0.0) | 0 ( 0.0) |
| 20409 (100.0) | 0 ( 0.0) | 20409 (100.0) |
| CMH Chi-Square |
|---|
| Too many cells have 0 obs |

|
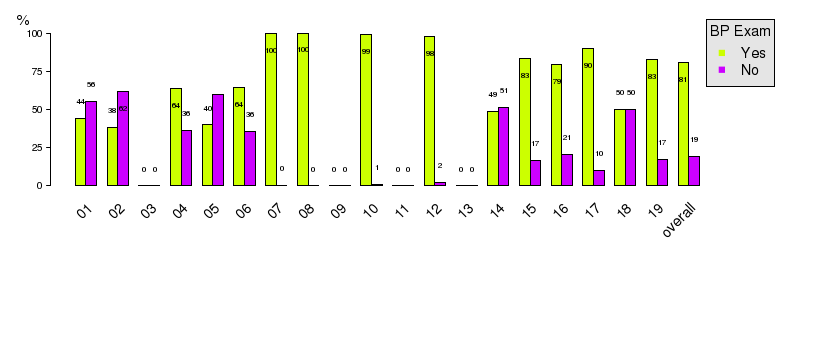
| BP Exam | Age Classes | ||||||
|---|---|---|---|---|---|---|---|
| <15 (%) | [15 - 25) (%) | [25 - 50) (%) | [50 - 65) (%) | [65 - 80) (%) | >=80 (%) | ||
| Yes | 663 ( 59.5) | 2310 ( 80.5) | 8029 ( 83.1) | 4030 ( 87.4) | 1658 ( 88.4) | 238 ( 86.5) | 16928 ( 82.9) |
| No | 452 ( 40.5) | 558 ( 19.5) | 1633 ( 16.9) | 583 ( 12.6) | 218 ( 11.6) | 37 ( 13.5) | 3481 ( 17.1) |
| 1115 ( 5.5) | 2868 ( 14.1) | 9662 ( 47.3) | 4613 ( 22.6) | 1876 ( 9.2) | 275 ( 1.3) | 20409 (100.0) |
| CMH Chi-Square | p.value | df |
|---|---|---|
| 551.7747 | 0 | 5 |

|

|
|

|

|

|

|
| BP Exam | Age Classes | ||
|---|---|---|---|
| Valid Value (%) | NV/NA (%) | ||
| Valid Value | 175240 (100.0) | 0 ( 0.0) | 175240 (100.0) |
| NV/NA | 0 ( 0.0) | 0 ( 0.0) | 0 ( 0.0) |
| 175240 (100.0) | 0 ( 0.0) | 175240 (100.0) |
| CMH Chi-Square |
|---|
| Too many cells have 0 obs |

|
| BP Exam | Age Classes | ||||||
|---|---|---|---|---|---|---|---|
| <15 (%) | [15 - 25) (%) | [25 - 50) (%) | [50 - 65) (%) | [65 - 80) (%) | >=80 (%) | ||
| Yes | 11 ( 84.6) | 107 ( 69.0) | 10900 ( 83.5) | 50184 ( 86.0) | 70086 ( 86.5) | 19112 ( 84.4) | 150400 ( 85.8) |
| No | 2 ( 15.4) | 48 ( 31.0) | 2156 ( 16.5) | 8159 ( 14.0) | 10931 ( 13.5) | 3544 ( 15.6) | 24840 ( 14.2) |
| 13 ( 0.0) | 155 ( 0.1) | 13056 ( 7.5) | 58343 ( 33.3) | 81017 ( 46.2) | 22656 ( 12.9) | 175240 (100.0) |
| CMH Chi-Square | p.value | df |
|---|---|---|
| 167.5307 | 0 | 5 |

|

|

|

|

|

|

|
| BP Exam | Age Classes | ||
|---|---|---|---|
| Valid Value (%) | NV/NA (%) | ||
| Valid Value | 3870 (100.0) | 0 ( 0.0) | 3870 (100.0) |
| NV/NA | 0 ( 0.0) | 0 ( 0.0) | 0 ( 0.0) |
| 3870 (100.0) | 0 ( 0.0) | 3870 (100.0) |
| CMH Chi-Square |
|---|
| Too many cells have 0 obs |

|
| BP Exam | Age Classes | ||||||
|---|---|---|---|---|---|---|---|
| <15 (%) | [15 - 25) (%) | [25 - 50) (%) | [50 - 65) (%) | [65 - 80) (%) | >=80 (%) | ||
| Yes | 7 ( 24.1) | 66 ( 64.1) | 1051 ( 72.8) | 777 ( 70.9) | 702 ( 72.6) | 152 ( 65.5) | 2755 ( 71.2) |
| No | 22 ( 75.9) | 37 ( 35.9) | 392 ( 27.2) | 319 ( 29.1) | 265 ( 27.4) | 80 ( 34.5) | 1115 ( 28.8) |
| 29 ( 0.7) | 103 ( 2.7) | 1443 ( 37.3) | 1096 ( 28.3) | 967 ( 25.0) | 232 ( 6.0) | 3870 (100.0) |
| CMH Chi-Square | p.value | df |
|---|---|---|
| 40.3636 | 0 | 5 |

|

|

|

|

|

|

|
| Copyright BIRO Consortium |