| Foot Exam |
Valid Value (%) |
NV/NA (%) |
|
| Valid Value |
163356 ( 84.7) |
0 ( 0.0) |
163356 ( 84.7) |
| NV/NA |
29407 ( 15.3) |
0 ( 0.0) |
29407 ( 15.3) |
|
192763 (100.0) |
0 ( 0.0) |
192763 (100.0) |
Table 3.3.1.1.1 : Foot Exam (by Type of Diabetes)
| CMH Chi-Square |
p.value |
df |
| 93079.7643 |
0 |
1 |

|
Barplot 3.3.1.1.1 - Foot Exam (by Type of Diabetes)
| Foot Exam |
Type 1 (%) |
Type 2 (%) |
Other Type (%) |
|
| Yes |
9710 ( 61.6) |
89272 ( 61.8) |
1143 ( 36.7) |
100125 ( 61.3) |
| No |
6064 ( 38.4) |
55194 ( 38.2) |
1973 ( 63.3) |
63231 ( 38.7) |
|
15774 ( 9.7) |
144466 ( 88.4) |
3116 ( 1.9) |
163356 (100.0) |
Table 3.3.1.1.2 : Foot Exam (by Type of Diabetes)
| CMH Chi-Square |
p.value |
df |
| 811.3237 |
0 |
2 |

|
Barplot 3.3.1.1.2 - Foot Exam (by Type of Diabetes)

|
Barplot 3.3.1.1.2a - Foot Exam (by Data Source, Type of Diabetes = Type 1)

|
Barplot 3.3.1.1.2b - Foot Exam (by Data Source, Type of Diabetes = Type 2)

|
Barplot 3.3.1.1.2c - Foot Exam (by Data Source, Type of Diabetes = Other Type)
| Foot Exam |
Valid Value (%) |
NV/NA (%) |
|
| Valid Value |
163356 ( 84.7) |
0 ( 0.0) |
163356 ( 84.7) |
| NV/NA |
29407 ( 15.3) |
0 ( 0.0) |
29407 ( 15.3) |
|
192763 (100.0) |
0 ( 0.0) |
192763 (100.0) |
Table 3.3.1.1.3 : Foot Exam (by Age Classes)
| CMH Chi-Square |
p.value |
df |
| 93079.7643 |
0 |
1 |

|
Barplot 3.3.1.1.3 - Foot Exam (by Age Classes)
| Foot Exam |
<15 (%) |
[15 - 25) (%) |
[25 - 50) (%) |
[50 - 65) (%) |
[65 - 80) (%) |
>=80 (%) |
|
| Yes |
601 ( 60.7) |
1242 ( 54.0) |
10779 ( 57.8) |
32199 ( 63.7) |
43368 ( 61.8) |
11936 ( 57.8) |
100125 ( 61.3) |
| No |
389 ( 39.3) |
1059 ( 46.0) |
7854 ( 42.2) |
18369 ( 36.3) |
26837 ( 38.2) |
8723 ( 42.2) |
63231 ( 38.7) |
|
990 ( 0.6) |
2301 ( 1.4) |
18633 ( 11.4) |
50568 ( 31.0) |
70205 ( 43.0) |
20659 ( 12.6) |
163356 (100.0) |
Table 3.3.1.1.4 : Foot Exam (by Age Classes)
| CMH Chi-Square |
p.value |
df |
| 380.6398 |
0 |
5 |

|
Barplot 3.3.1.1.4 - Foot Exam (by Age Classes)

|
Barplot 3.3.1.1.4a - Foot Exam (by Data Source, Age Classes = <15)

|
Barplot 3.3.1.1.4b - Foot Exam (by Data Source, Age Classes = [15 - 25))

|
Barplot 3.3.1.1.4c - Foot Exam (by Data Source, Age Classes = [25 - 50))

|
Barplot 3.3.1.1.4d - Foot Exam (by Data Source, Age Classes = [50 - 65))

|
Barplot 3.3.1.1.4e - Foot Exam (by Data Source, Age Classes = [65 - 80))

|
Barplot 3.3.1.1.4f - Foot Exam (by Data Source, Age Classes = >=80)
| Foot Exam |
Age Classes |
|
| Valid Value (%) |
NV/NA (%) |
|
| Valid Value |
15774 ( 80.6) |
0 ( 0.0) |
15774 ( 80.6) |
| NV/NA |
3800 ( 19.4) |
0 ( 0.0) |
3800 ( 19.4) |
|
19574 (100.0) |
0 ( 0.0) |
19574 (100.0) |
Table 3.3.1.1.5 : Foot Exam (by Age Classes, Type of Diabetes = Type 1)
| CMH Chi-Square |
p.value |
df |
| 7324.8532 |
0 |
1 |

|
Barplot 3.3.1.1.5 - Foot Exam (by Age Classes, Type of Diabetes = Type 1)
| Foot Exam |
Age Classes |
|
| <15 (%) |
[15 - 25) (%) |
[25 - 50) (%) |
[50 - 65) (%) |
[65 - 80) (%) |
>=80 (%) |
|
| Yes |
588 ( 61.7) |
1168 ( 55.4) |
4240 ( 58.2) |
2462 ( 67.8) |
1077 ( 68.8) |
175 ( 75.1) |
9710 ( 61.6) |
| No |
365 ( 38.3) |
940 ( 44.6) |
3045 ( 41.8) |
1168 ( 32.2) |
488 ( 31.2) |
58 ( 24.9) |
6064 ( 38.4) |
|
953 ( 6.0) |
2108 ( 13.4) |
7285 ( 46.2) |
3630 ( 23.0) |
1565 ( 9.9) |
233 ( 1.5) |
15774 (100.0) |
Table 3.3.1.1.6 : Foot Exam (by Age Classes, Type of Diabetes = Type 1)
| CMH Chi-Square |
p.value |
df |
| 181.5299 |
0 |
5 |

|
Barplot 3.3.1.1.6 - Foot Exam (by Age Classes, Type of Diabetes = Type 1)

|
Barplot 3.3.1.1.6a - Foot Exam (by Data Source, Age Classes = <15, Type of Diabetes=Type 1)

|
Barplot 3.3.1.1.6b - Foot Exam (by Data Source, Age Classes = [15 - 25), Type of Diabetes=Type 1)

|
Barplot 3.3.1.1.6c - Foot Exam (by Data Source, Age Classes = [25 - 50), Type of Diabetes=Type 1)

|
Barplot 3.3.1.1.6d - Foot Exam (by Data Source, Age Classes = [50 - 65), Type of Diabetes=Type 1)

|
Barplot 3.3.1.1.6e - Foot Exam (by Data Source, Age Classes = [65 - 80), Type of Diabetes=Type 1)

|
Barplot 3.3.1.1.6f - Foot Exam (by Data Source, Age Classes = >=80, Type of Diabetes=Type 1)
| Foot Exam |
Age Classes |
|
| Valid Value (%) |
NV/NA (%) |
|
| Valid Value |
144466 ( 85.3) |
0 ( 0.0) |
144466 ( 85.3) |
| NV/NA |
24939 ( 14.7) |
0 ( 0.0) |
24939 ( 14.7) |
|
169405 (100.0) |
0 ( 0.0) |
169405 (100.0) |
Table 3.3.1.1.7 : Foot Exam (by Age Classes, Type of Diabetes = Type 2)
| CMH Chi-Square |
p.value |
df |
| 84334.6048 |
0 |
1 |

|
Barplot 3.3.1.1.7 - Foot Exam (by Age Classes, Type of Diabetes = Type 2)
| Foot Exam |
Age Classes |
|
| <15 (%) |
[15 - 25) (%) |
[25 - 50) (%) |
[50 - 65) (%) |
[65 - 80) (%) |
>=80 (%) |
|
| Yes |
9 ( 81.8) |
50 ( 50.0) |
6258 ( 62.0) |
29360 ( 63.7) |
41926 ( 61.7) |
11669 ( 57.7) |
89272 ( 61.8) |
| No |
2 ( 18.2) |
50 ( 50.0) |
3843 ( 38.0) |
16763 ( 36.3) |
25974 ( 38.3) |
8562 ( 42.3) |
55194 ( 38.2) |
|
11 ( 0.0) |
100 ( 0.1) |
10101 ( 7.0) |
46123 ( 31.9) |
67900 ( 47.0) |
20231 ( 14.0) |
144466 (100.0) |
Table 3.3.1.1.8 : Foot Exam (by Age Classes, Type of Diabetes = Type 2)
| CMH Chi-Square |
p.value |
df |
| 220.7764 |
0 |
5 |

|
Barplot 3.3.1.1.8 - Foot Exam (by Age Classes, Type of Diabetes = Type 2)

|
Barplot 3.3.1.1.8a - Foot Exam (by Data Source, Age Classes = <15, Type of Diabetes=Type 2)

|
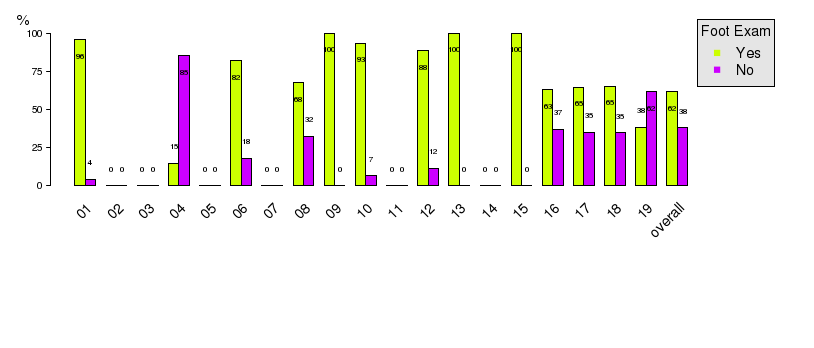
Barplot 3.3.1.1.8b - Foot Exam (by Data Source, Age Classes = [15 - 25), Type of Diabetes=Type 2)
|
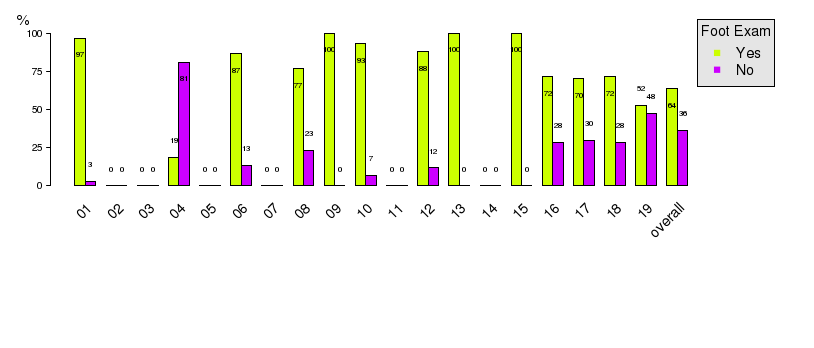
Barplot 3.3.1.1.8c - Foot Exam (by Data Source, Age Classes = [25 - 50), Type of Diabetes=Type 2)
|
Barplot 3.3.1.1.8d - Foot Exam (by Data Source, Age Classes = [50 - 65), Type of Diabetes=Type 2)

|
Barplot 3.3.1.1.8e - Foot Exam (by Data Source, Age Classes = [65 - 80), Type of Diabetes=Type 2)

|
Barplot 3.3.1.1.8f - Foot Exam (by Data Source, Age Classes = >=80, Type of Diabetes=Type 2)
| Foot Exam |
Age Classes |
|
| Valid Value (%) |
NV/NA (%) |
|
| Valid Value |
3116 ( 82.3) |
0 ( 0.0) |
3116 ( 82.3) |
| NV/NA |
668 ( 17.7) |
0 ( 0.0) |
668 ( 17.7) |
|
3784 (100.0) |
0 ( 0.0) |
3784 (100.0) |
Table 3.3.1.1.9 : Foot Exam (by Age Classes, Type of Diabetes = Other Type)
| CMH Chi-Square |
p.value |
df |
| 1583.6956 |
0 |
1 |

|
Barplot 3.3.1.1.9 - Foot Exam (by Age Classes, Type of Diabetes = Other Type)
| Foot Exam |
Age Classes |
|
| <15 (%) |
[15 - 25) (%) |
[25 - 50) (%) |
[50 - 65) (%) |
[65 - 80) (%) |
>=80 (%) |
|
| Yes |
4 ( 15.4) |
24 ( 25.8) |
281 ( 22.5) |
377 ( 46.3) |
365 ( 49.3) |
92 ( 47.2) |
1143 ( 36.7) |
| No |
22 ( 84.6) |
69 ( 74.2) |
966 ( 77.5) |
438 ( 53.7) |
375 ( 50.7) |
103 ( 52.8) |
1973 ( 63.3) |
|
26 ( 0.8) |
93 ( 3.0) |
1247 ( 40.0) |
815 ( 26.2) |
740 ( 23.7) |
195 ( 6.3) |
3116 (100.0) |
Table 3.3.1.1.10 : Foot Exam (by Age Classes, Type of Diabetes = Other Type)
| CMH Chi-Square |
p.value |
df |
| 209.6289 |
0 |
5 |

|
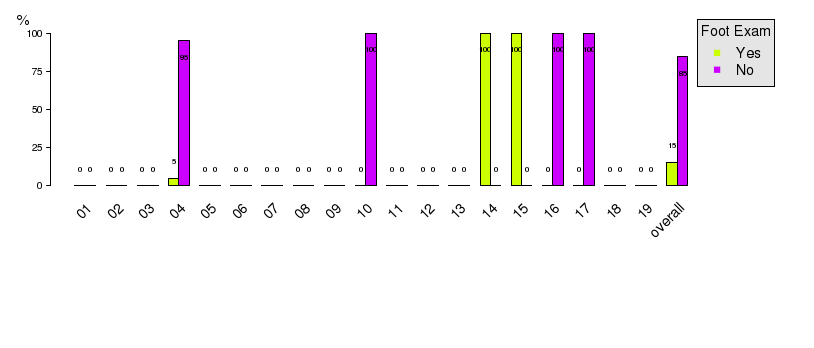
Barplot 3.3.1.1.10 - Foot Exam (by Age Classes, Type of Diabetes = Other Type)
|
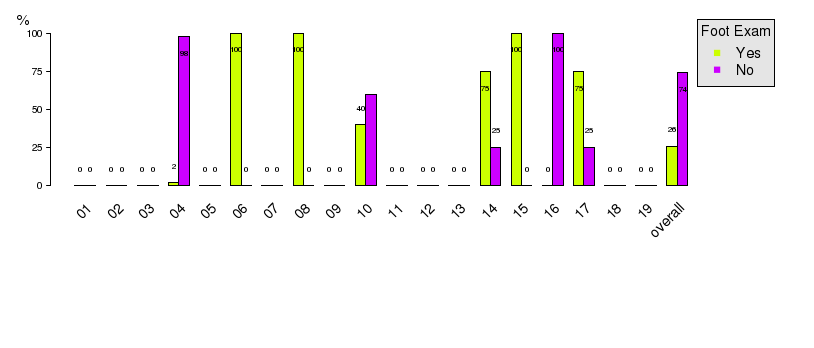
Barplot 3.3.1.1.10a - Foot Exam (by Data Source, Age Classes = <15, Type of Diabetes=Other Type)
|
Barplot 3.3.1.1.10b - Foot Exam (by Data Source, Age Classes = [15 - 25), Type of Diabetes=Other Type)
|
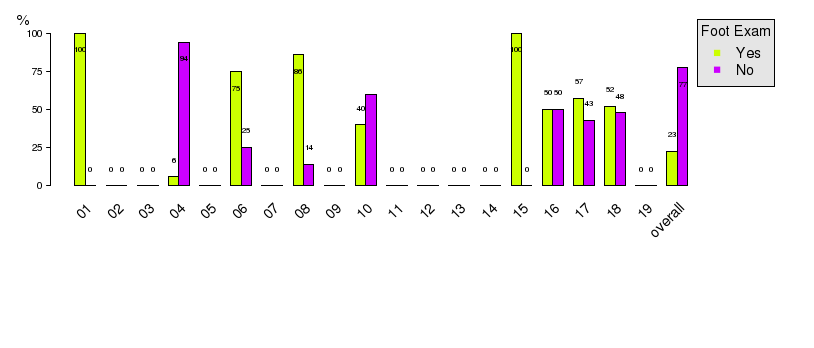
Barplot 3.3.1.1.10c - Foot Exam (by Data Source, Age Classes = [25 - 50), Type of Diabetes=Other Type)

|
Barplot 3.3.1.1.10d - Foot Exam (by Data Source, Age Classes = [50 - 65), Type of Diabetes=Other Type)

|
Barplot 3.3.1.1.10e - Foot Exam (by Data Source, Age Classes = [65 - 80), Type of Diabetes=Other Type)
|
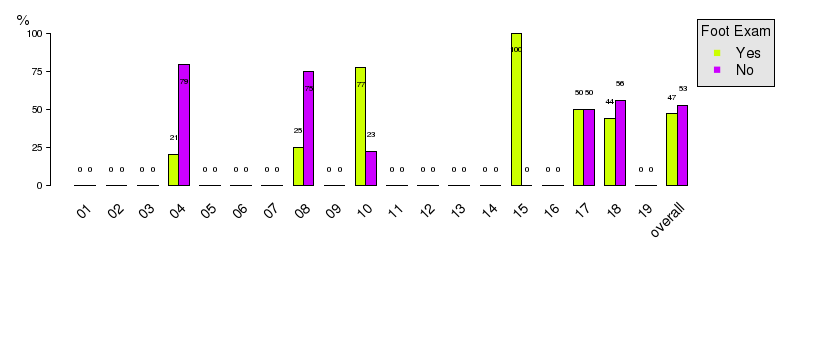
Barplot 3.3.1.1.10f - Foot Exam (by Data Source, Age Classes = >=80, Type of Diabetes=Other Type)
