| Amputation |
Valid Value (%) |
NV/NA (%) |
|
| Valid Value |
164497 ( 89.0) |
0 ( 0.0) |
164497 ( 89.0) |
| NV/NA |
20332 ( 11.0) |
0 ( 0.0) |
20332 ( 11.0) |
|
184829 (100.0) |
0 ( 0.0) |
184829 (100.0) |
Table 2.3.4.1 : Amputation (by Duration)
| CMH Chi-Square |
p.value |
df |
| 112447.4364 |
0 |
1 |

|
Barplot 2.3.4.1 - Amputation (by Duration)
| Amputation |
<10 (%) |
[10 - 20) (%) |
>=20 (%) |
|
| Yes |
434 ( 0.4) |
476 ( 1.1) |
503 ( 2.1) |
1413 ( 0.9) |
| No |
97966 ( 99.6) |
41954 ( 98.9) |
23164 ( 97.9) |
163084 ( 99.1) |
|
98400 ( 59.8) |
42430 ( 25.8) |
23667 ( 14.4) |
164497 (100.0) |
Table 2.3.4.2 : Amputation (by Duration)
| CMH Chi-Square |
p.value |
df |
| 681.9056 |
0 |
2 |

|
Barplot 2.3.4.2 - Amputation (by Duration)

|
Barplot 2.3.4.2a - Amputation (by Data Source, Duration = <10)
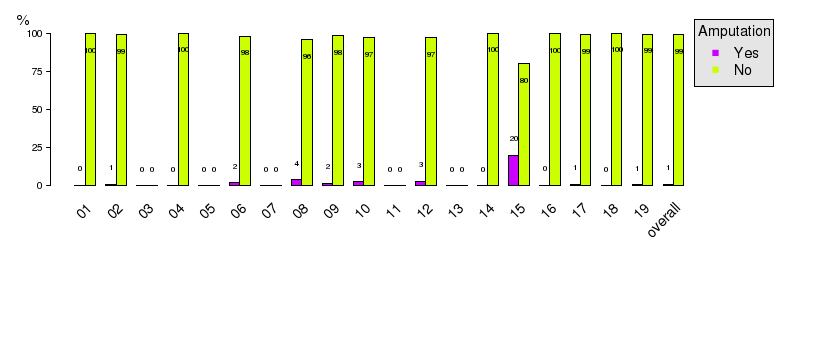
|
Barplot 2.3.4.2b - Amputation (by Data Source, Duration = [10 - 20))

|
Barplot 2.3.4.2c - Amputation (by Data Source, Duration = >=20)
