| HbA1c |
Valid Value (%) |
NV/NA (%) |
|
| Valid Value |
168948 ( 84.5) |
0 ( 0.0) |
168948 ( 84.5) |
| NV/NA |
30954 ( 15.5) |
0 ( 0.0) |
30954 ( 15.5) |
|
199902 (100.0) |
0 ( 0.0) |
199902 (100.0) |
Table 2.2.3.6.1 : HbA1c (by Type of Diabetes)
| CMH Chi-Square |
p.value |
df |
| 95258.3968 |
0 |
1 |

|
Barplot 2.2.3.6.1 - HbA1c (by Type of Diabetes)
| HbA1c |
Type 1 (%) |
Type 2 (%) |
Other Type (%) |
|
| <6.5 |
2011 ( 10.9) |
45109 ( 30.4) |
1056 ( 50.7) |
48176 ( 28.5) |
| [6.5 - 7.5) |
4697 ( 25.5) |
52799 ( 35.6) |
471 ( 22.6) |
57967 ( 34.3) |
| >=7.5 |
11713 ( 63.6) |
50537 ( 34.0) |
555 ( 26.7) |
62805 ( 37.2) |
|
18421 ( 10.9) |
148445 ( 87.9) |
2082 ( 1.2) |
168948 (100.0) |
Table 2.2.3.6.2 : HbA1c (by Type of Diabetes)
| CMH Chi-Square |
p.value |
df |
| 7021.1225 |
0 |
4 |

|
Barplot 2.2.3.6.2 - HbA1c (by Type of Diabetes)

|
Barplot 2.2.3.6.2a - HbA1c (by Data Source, Type of Diabetes = Type 1)

|
Barplot 2.2.3.6.2b - HbA1c (by Data Source, Type of Diabetes = Type 2)

|
Barplot 2.2.3.6.2c - HbA1c (by Data Source, Type of Diabetes = Other Type)
| HbA1c |
Valid Value (%) |
NV/NA (%) |
|
| Valid Value |
168948 ( 84.5) |
0 ( 0.0) |
168948 ( 84.5) |
| NV/NA |
30954 ( 15.5) |
0 ( 0.0) |
30954 ( 15.5) |
|
199902 (100.0) |
0 ( 0.0) |
199902 (100.0) |
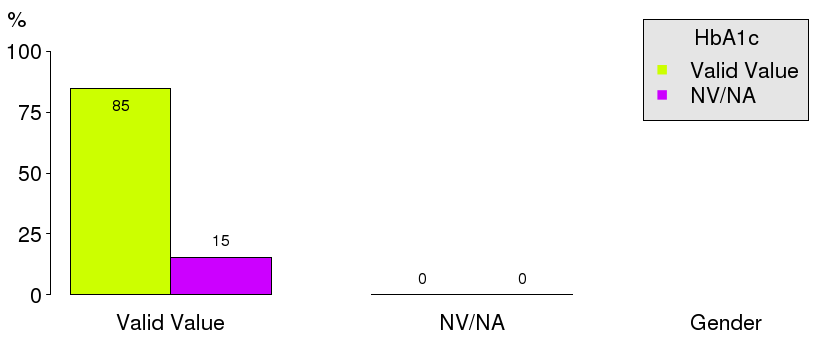
Table 2.2.3.6.3 : HbA1c (by Gender)
| CMH Chi-Square |
p.value |
df |
| 95258.3968 |
0 |
1 |
|
Barplot 2.2.3.6.3 - HbA1c (by Gender)
| HbA1c |
Male (%) |
Female (%) |
|
| <6.5 |
22116 ( 27.3) |
26060 ( 29.6) |
48176 ( 28.5) |
| [6.5 - 7.5) |
27887 ( 34.5) |
30080 ( 34.2) |
57967 ( 34.3) |
| >=7.5 |
30894 ( 38.2) |
31911 ( 36.2) |
62805 ( 37.2) |
|
80897 ( 47.9) |
88051 ( 52.1) |
168948 (100.0) |
Table 2.2.3.6.4 : HbA1c (by Gender)
| CMH Chi-Square |
p.value |
df |
| 119.5977 |
0 |
2 |

|
Barplot 2.2.3.6.4 - HbA1c (by Gender)

|
Barplot 2.2.3.6.4a - HbA1c (by Data Source, Gender = Male)

|
Barplot 2.2.3.6.4b - HbA1c (by Data Source, Gender = Female)
| HbA1c |
Valid Value (%) |
NV/NA (%) |
|
| Valid Value |
168948 ( 84.5) |
0 ( 0.0) |
168948 ( 84.5) |
| NV/NA |
30954 ( 15.5) |
0 ( 0.0) |
30954 ( 15.5) |
|
199902 (100.0) |
0 ( 0.0) |
199902 (100.0) |
Table 2.2.3.6.5 : HbA1c (by Age)
| CMH Chi-Square |
p.value |
df |
| 95258.3968 |
0 |
1 |

|
Barplot 2.2.3.6.5 - HbA1c (by Age)
| HbA1c |
<15 (%) |
[15 - 25) (%) |
[25 - 50) (%) |
[50 - 65) (%) |
[65 - 80) (%) |
>=80 (%) |
|
| <6.5 |
137 ( 14.0) |
318 ( 11.4) |
4939 ( 24.2) |
14836 ( 27.1) |
21546 ( 30.3) |
6400 ( 33.9) |
48176 ( 28.5) |
| [6.5 - 7.5) |
239 ( 24.4) |
559 ( 20.0) |
5362 ( 26.2) |
18162 ( 33.2) |
26727 ( 37.6) |
6918 ( 36.7) |
57967 ( 34.3) |
| >=7.5 |
604 ( 61.6) |
1920 ( 68.6) |
10133 ( 49.6) |
21714 ( 39.7) |
22889 ( 32.2) |
5545 ( 29.4) |
62805 ( 37.2) |
|
980 ( 0.6) |
2797 ( 1.7) |
20434 ( 12.1) |
54712 ( 32.4) |
71162 ( 42.1) |
18863 ( 11.2) |
168948 (100.0) |
Table 2.2.3.6.6 : HbA1c (by Age)
| CMH Chi-Square |
p.value |
df |
| 4288.1482 |
0 |
10 |

|
Barplot 2.2.3.6.6 - HbA1c (by Age)

|
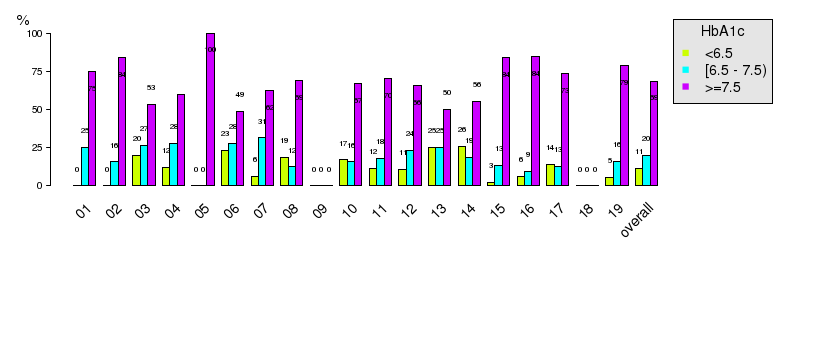
Barplot 2.2.3.6.6a - HbA1c (by Data Source, Age = <15)
|
Barplot 2.2.3.6.6b - HbA1c (by Data Source, Age = [15 - 25))

|
Barplot 2.2.3.6.6c - HbA1c (by Data Source, Age = [25 - 50))

|
Barplot 2.2.3.6.6d - HbA1c (by Data Source, Age = [50 - 65))

|
Barplot 2.2.3.6.6e - HbA1c (by Data Source, Age = [65 - 80))

|
Barplot 2.2.3.6.6f - HbA1c (by Data Source, Age = >=80)
| HbA1c |
Gender |
|
| Valid Value (%) |
NV/NA (%) |
|
| Valid Value |
18421 ( 89.1) |
0 ( 0.0) |
18421 ( 89.1) |
| NV/NA |
2262 ( 10.9) |
0 ( 0.0) |
2262 ( 10.9) |
|
20683 (100.0) |
0 ( 0.0) |
20683 (100.0) |
Table 2.2.3.6.7 : HbA1c (by Gender, Type of Diabetes = Type 1)
| CMH Chi-Square |
p.value |
df |
| 12624.5361 |
0 |
1 |

|
Barplot 2.2.3.6.7 - HbA1c (by Gender, Type of Diabetes = Type 1)
| HbA1c |
Gender |
|
| Male (%) |
Female (%) |
|
| <6.5 |
1166 ( 11.7) |
845 ( 10.0) |
2011 ( 10.9) |
| [6.5 - 7.5) |
2602 ( 26.2) |
2095 ( 24.7) |
4697 ( 25.5) |
| >=7.5 |
6171 ( 62.1) |
5542 ( 65.3) |
11713 ( 63.6) |
|
9939 ( 54.0) |
8482 ( 46.0) |
18421 (100.0) |
Table 2.2.3.6.8 : HbA1c (by Gender, Type of Diabetes = Type 1)
| CMH Chi-Square |
p.value |
df |
| 24.6564 |
0 |
2 |

|
Barplot 2.2.3.6.8 - HbA1c (by Gender, Type of Diabetes = Type 1)
|
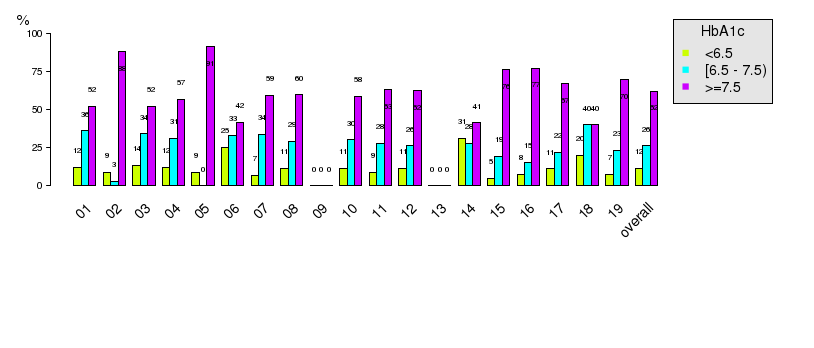
Barplot 2.2.3.6.8a - HbA1c (by Data Source, Gender = Male, Type of Diabetes=Type 1)

|
Barplot 2.2.3.6.8b - HbA1c (by Data Source, Gender = Female, Type of Diabetes=Type 1)
| HbA1c |
Age |
|
| Valid Value (%) |
NV/NA (%) |
|
| Valid Value |
18421 ( 89.1) |
0 ( 0.0) |
18421 ( 89.1) |
| NV/NA |
2262 ( 10.9) |
0 ( 0.0) |
2262 ( 10.9) |
|
20683 (100.0) |
0 ( 0.0) |
20683 (100.0) |
Table 2.2.3.6.9 : HbA1c (by Age, Type of Diabetes = Type 1)
| CMH Chi-Square |
p.value |
df |
| 12624.5361 |
0 |
1 |

|
Barplot 2.2.3.6.9 - HbA1c (by Gender, Type of Diabetes = Type 1)
| HbA1c |
Age |
|
| <15 (%) |
[15 - 25) (%) |
[25 - 50) (%) |
[50 - 65) (%) |
[65 - 80) (%) |
>=80 (%) |
|
| <6.5 |
119 ( 12.5) |
224 ( 8.5) |
1052 ( 12.0) |
391 ( 9.3) |
203 ( 12.0) |
22 ( 9.2) |
2011 ( 10.9) |
| [6.5 - 7.5) |
236 ( 24.7) |
535 ( 20.4) |
2204 ( 25.2) |
1103 ( 26.4) |
527 ( 31.2) |
92 ( 38.5) |
4697 ( 25.5) |
| >=7.5 |
599 ( 62.8) |
1864 ( 71.1) |
5477 ( 62.7) |
2688 ( 64.3) |
960 ( 56.8) |
125 ( 52.3) |
11713 ( 63.6) |
|
954 ( 5.2) |
2623 ( 14.2) |
8733 ( 47.4) |
4182 ( 22.7) |
1690 ( 9.2) |
239 ( 1.3) |
18421 (100.0) |
Table 2.2.3.6.10 : HbA1c (by Age, Type of Diabetes = Type 1)
| CMH Chi-Square |
p.value |
df |
| 145.0643 |
0 |
10 |

|
Barplot 2.2.3.6.10 - HbA1c (by Age, Type of Diabetes = Type 1)

|
Barplot 2.2.3.6.10a - HbA1c (by Data Source, Age = <15, Type of Diabetes=Type 1)

|
Barplot 2.2.3.6.10b - HbA1c (by Data Source, Age = [15 - 25), Type of Diabetes=Type 1)

|
Barplot 2.2.3.6.10c - HbA1c (by Data Source, Age = [25 - 50), Type of Diabetes=Type 1)

|
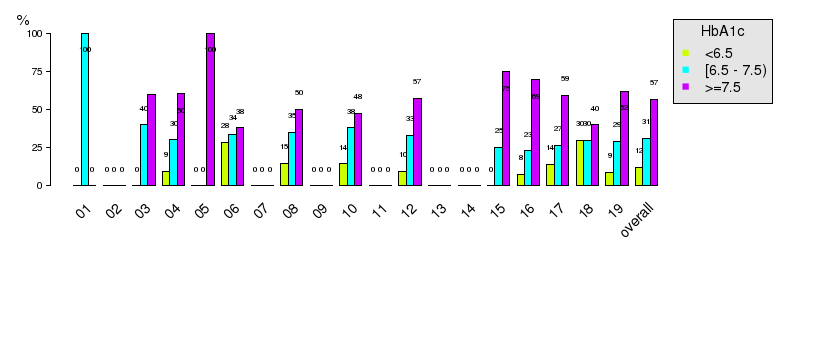
Barplot 2.2.3.6.10d - HbA1c (by Data Source, Age = [50 - 65), Type of Diabetes=Type 1)
|
Barplot 2.2.3.6.10e - HbA1c (by Data Source, Age = [65 - 80), Type of Diabetes=Type 1)

|
Barplot 2.2.3.6.10f - HbA1c (by Data Source, Age = >=80, Type of Diabetes=Type 1)
| HbA1c |
Gender * Age |
|
| Valid Value |
NV/NA |
|
Valid Value (%) |
NV/NA (%) |
Valid Value (%) |
NV/NA (%) |
|
| Valid Value |
18421 ( 89.1) |
0 ( 0.0) |
0 ( 0.0) |
0 ( 0.0) |
18421 ( 89.1) |
| NV/NA |
2262 ( 10.9) |
0 ( 0.0) |
0 ( 0.0) |
0 ( 0.0) |
2262 ( 10.9) |
|
20683 (100.0) |
0 ( 0.0) |
0 ( 0.0) |
0 ( 0.0) |
20683 (100.0) |
Table 2.2.3.6.11 : HbA1c (by Gender * Age, Type of Diabetes = Type 1)
| HbA1c |
Gender * Age |
|
| <15 |
[15 - 25) |
[25 - 50) |
[50 - 65) |
[65 - 80) |
>=80 |
|
Male (%) |
Female (%) |
Male (%) |
Female (%) |
Male (%) |
Female (%) |
Male (%) |
Female (%) |
Male (%) |
Female (%) |
Male (%) |
Female (%) |
|
| <6.5 |
56 ( 11.9) |
63 ( 13.0) |
88 ( 7.3) |
136 ( 9.6) |
465 ( 12.0) |
587 ( 12.1) |
152 ( 8.1) |
239 ( 10.4) |
77 ( 8.5) |
126 ( 16.0) |
7 ( 5.2) |
15 ( 14.3) |
2011 ( 10.9) |
| [6.5 - 7.5) |
110 ( 23.5) |
126 ( 26.0) |
243 ( 20.1) |
292 ( 20.7) |
938 ( 24.1) |
1266 ( 26.1) |
483 ( 25.7) |
620 ( 26.9) |
275 ( 30.5) |
252 ( 32.0) |
46 ( 34.3) |
46 ( 43.8) |
4697 ( 25.5) |
| >=7.5 |
303 ( 64.6) |
296 ( 61.0) |
878 ( 72.6) |
986 ( 69.7) |
2483 ( 63.9) |
2994 ( 61.8) |
1246 ( 66.2) |
1442 ( 62.7) |
551 ( 61.0) |
409 ( 52.0) |
81 ( 60.4) |
44 ( 41.9) |
11713 ( 63.6) |
|
469 ( 2.5) |
485 ( 2.6) |
1209 ( 6.6) |
1414 ( 7.7) |
3886 ( 21.1) |
4847 ( 26.3) |
1881 ( 10.2) |
2301 ( 12.5) |
903 ( 4.9) |
787 ( 4.3) |
134 ( 0.7) |
105 ( 0.6) |
18421 (100.0) |
Table 2.2.3.6.12 : HbA1c (by Gender * Age, Type of Diabetes = Type 1)
| CMH Chi-Square |
p.value |
df |
| 30974.633 |
0 |
35 |
| HbA1c |
Gender |
|
| Valid Value (%) |
NV/NA (%) |
|
| Valid Value |
148445 ( 84.7) |
0 ( 0.0) |
148445 ( 84.7) |
| NV/NA |
26904 ( 15.3) |
0 ( 0.0) |
26904 ( 15.3) |
|
175349 (100.0) |
0 ( 0.0) |
175349 (100.0) |
Table 2.2.3.6.13 : HbA1c (by Gender, Type of Diabetes = Type 2)
| CMH Chi-Square |
p.value |
df |
| 84244.6474 |
0 |
1 |

|
Barplot 2.2.3.6.11 - HbA1c (by Gender, Type of Diabetes = Type 2)
| HbA1c |
Gender |
|
| Male (%) |
Female (%) |
|
| <6.5 |
20683 ( 29.5) |
24426 ( 31.2) |
45109 ( 30.4) |
| [6.5 - 7.5) |
25047 ( 35.7) |
27752 ( 35.4) |
52799 ( 35.6) |
| >=7.5 |
24369 ( 34.8) |
26168 ( 33.4) |
50537 ( 34.0) |
|
70099 ( 47.2) |
78346 ( 52.8) |
148445 (100.0) |
Table 2.2.3.6.14 : HbA1c (by Gender, Type of Diabetes = Type 2)
| CMH Chi-Square |
p.value |
df |
| 55.2056 |
0 |
2 |

|
Barplot 2.2.3.6.12 - HbA1c (by Gender, Type of Diabetes = Type 2)
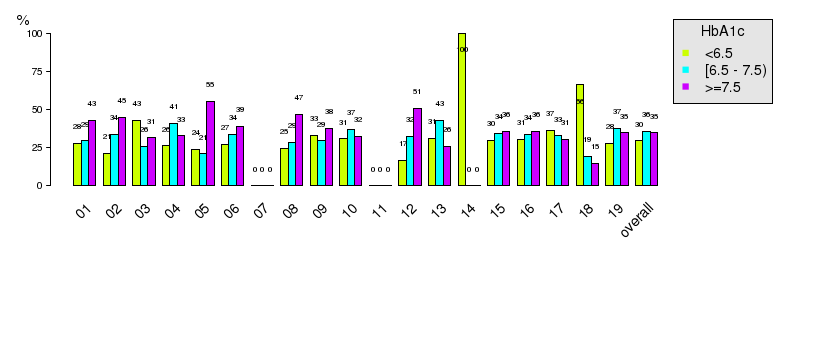
|
Barplot 2.2.3.6.12a - HbA1c (by Data Source, Gender = Male, Type of Diabetes=Type 2)

|
Barplot 2.2.3.6.12b - HbA1c (by Data Source, Gender = Female, Type of Diabetes=Type 2)
| HbA1c |
Age |
|
| Valid Value (%) |
NV/NA (%) |
|
| Valid Value |
148445 ( 84.7) |
0 ( 0.0) |
148445 ( 84.7) |
| NV/NA |
26904 ( 15.3) |
0 ( 0.0) |
26904 ( 15.3) |
|
175349 (100.0) |
0 ( 0.0) |
175349 (100.0) |
Table 2.2.3.6.15 : HbA1c (by Age, Type of Diabetes = Type 2)
| CMH Chi-Square |
p.value |
df |
| 84244.6474 |
0 |
1 |

|
Barplot 2.2.3.6.13 - HbA1c (by Gender, Type of Diabetes = Type 2)
| HbA1c |
Age |
|
| <15 (%) |
[15 - 25) (%) |
[25 - 50) (%) |
[50 - 65) (%) |
[65 - 80) (%) |
>=80 (%) |
|
| <6.5 |
7 ( 63.6) |
46 ( 40.4) |
3294 ( 30.4) |
14256 ( 28.5) |
21176 ( 30.7) |
6330 ( 34.1) |
45109 ( 30.4) |
| [6.5 - 7.5) |
2 ( 18.2) |
20 ( 17.5) |
3042 ( 28.1) |
16885 ( 33.8) |
26038 ( 37.7) |
6812 ( 36.7) |
52799 ( 35.6) |
| >=7.5 |
2 ( 18.2) |
48 ( 42.1) |
4498 ( 41.5) |
18795 ( 37.6) |
21788 ( 31.6) |
5406 ( 29.1) |
50537 ( 34.0) |
|
11 ( 0.0) |
114 ( 0.1) |
10834 ( 7.3) |
49936 ( 33.6) |
69002 ( 46.5) |
18548 ( 12.5) |
148445 (100.0) |
Table 2.2.3.6.16 : HbA1c (by Age, Type of Diabetes = Type 2)
| CMH Chi-Square |
p.value |
df |
| 1098.6822 |
0 |
10 |

|
Barplot 2.2.3.6.14 - HbA1c (by Age, Type of Diabetes = Type 2)

|
Barplot 2.2.3.6.14a - HbA1c (by Data Source, Age = <15, Type of Diabetes=Type 2)

|
Barplot 2.2.3.6.14b - HbA1c (by Data Source, Age = [15 - 25), Type of Diabetes=Type 2)

|
Barplot 2.2.3.6.14c - HbA1c (by Data Source, Age = [25 - 50), Type of Diabetes=Type 2)

|
Barplot 2.2.3.6.14d - HbA1c (by Data Source, Age = [50 - 65), Type of Diabetes=Type 2)

|
Barplot 2.2.3.6.14e - HbA1c (by Data Source, Age = [65 - 80), Type of Diabetes=Type 2)

|
Barplot 2.2.3.6.14f - HbA1c (by Data Source, Age = >=80, Type of Diabetes=Type 2)
| HbA1c |
Gender * Age |
|
| Valid Value |
NV/NA |
|
Valid Value (%) |
NV/NA (%) |
Valid Value (%) |
NV/NA (%) |
|
| Valid Value |
148445 ( 84.7) |
0 ( 0.0) |
0 ( 0.0) |
0 ( 0.0) |
148445 ( 84.7) |
| NV/NA |
26904 ( 15.3) |
0 ( 0.0) |
0 ( 0.0) |
0 ( 0.0) |
26904 ( 15.3) |
|
175349 (100.0) |
0 ( 0.0) |
0 ( 0.0) |
0 ( 0.0) |
175349 (100.0) |
Table 2.2.3.6.17 : HbA1c (by Gender * Age, Type of Diabetes = Type 2)
| HbA1c |
Gender * Age |
|
| <15 |
[15 - 25) |
[25 - 50) |
[50 - 65) |
[65 - 80) |
>=80 |
|
Male (%) |
Female (%) |
Male (%) |
Female (%) |
Male (%) |
Female (%) |
Male (%) |
Female (%) |
Male (%) |
Female (%) |
Male (%) |
Female (%) |
|
| <6.5 |
2 ( 50.0) |
5 ( 71.4) |
29 ( 44.6) |
17 ( 34.7) |
1513 ( 33.9) |
1781 ( 28.0) |
6880 ( 29.2) |
7376 ( 28.0) |
11884 ( 31.0) |
9292 ( 30.4) |
4118 ( 34.7) |
2212 ( 33.1) |
45109 ( 30.4) |
| [6.5 - 7.5) |
0 ( 0.0) |
2 ( 28.6) |
9 ( 13.8) |
11 ( 22.4) |
1236 ( 27.7) |
1806 ( 28.4) |
8005 ( 34.0) |
8880 ( 33.7) |
14213 ( 37.0) |
11825 ( 38.6) |
4289 ( 36.2) |
2523 ( 37.7) |
52799 ( 35.6) |
| >=7.5 |
2 ( 50.0) |
0 ( 0.0) |
27 ( 41.5) |
21 ( 42.9) |
1719 ( 38.5) |
2779 ( 43.7) |
8667 ( 36.8) |
10128 ( 38.4) |
12296 ( 32.0) |
9492 ( 31.0) |
3457 ( 29.1) |
1949 ( 29.2) |
50537 ( 34.0) |
|
4 ( 0.0) |
7 ( 0.0) |
65 ( 0.0) |
49 ( 0.0) |
4468 ( 3.0) |
6366 ( 4.3) |
23552 ( 15.9) |
26384 ( 17.8) |
38393 ( 25.9) |
30609 ( 20.6) |
11864 ( 8.0) |
6684 ( 4.5) |
148445 (100.0) |
Table 2.2.3.6.18 : HbA1c (by Gender * Age, Type of Diabetes = Type 2)
| CMH Chi-Square |
p.value |
df |
| 170790.8207 |
0 |
35 |
| HbA1c |
Gender |
|
| Valid Value (%) |
NV/NA (%) |
|
| Valid Value |
2082 ( 53.8) |
0 ( 0.0) |
2082 ( 53.8) |
| NV/NA |
1788 ( 46.2) |
0 ( 0.0) |
1788 ( 46.2) |
|
3870 (100.0) |
0 ( 0.0) |
3870 (100.0) |
Table 2.2.3.6.19 : HbA1c (by Gender, Type of Diabetes = Other Type)
| CMH Chi-Square |
p.value |
df |
| 22.3349 |
0 |
1 |

|
Barplot 2.2.3.6.15 - HbA1c (by Gender, Type of Diabetes = Other Type)
| HbA1c |
Gender |
|
| Male (%) |
Female (%) |
|
| <6.5 |
267 ( 31.1) |
789 ( 64.5) |
1056 ( 50.7) |
| [6.5 - 7.5) |
238 ( 27.7) |
233 ( 19.1) |
471 ( 22.6) |
| >=7.5 |
354 ( 41.2) |
201 ( 16.4) |
555 ( 26.7) |
|
859 ( 41.3) |
1223 ( 58.7) |
2082 (100.0) |
Table 2.2.3.6.20 : HbA1c (by Gender, Type of Diabetes = Other Type)
| CMH Chi-Square |
p.value |
df |
| 244.0876 |
0 |
2 |

|
Barplot 2.2.3.6.16 - HbA1c (by Gender, Type of Diabetes = Other Type)

|
Barplot 2.2.3.6.16a - HbA1c (by Data Source, Gender = Male, Type of Diabetes=Other Type)

|
Barplot 2.2.3.6.16b - HbA1c (by Data Source, Gender = Female, Type of Diabetes=Other Type)
| HbA1c |
Age |
|
| Valid Value (%) |
NV/NA (%) |
|
| Valid Value |
2082 ( 53.8) |
0 ( 0.0) |
2082 ( 53.8) |
| NV/NA |
1788 ( 46.2) |
0 ( 0.0) |
1788 ( 46.2) |
|
3870 (100.0) |
0 ( 0.0) |
3870 (100.0) |
Table 2.2.3.6.21 : HbA1c (by Age, Type of Diabetes = Other Type)
| CMH Chi-Square |
p.value |
df |
| 22.3349 |
0 |
1 |

|
Barplot 2.2.3.6.17 - HbA1c (by Gender, Type of Diabetes = Other Type)
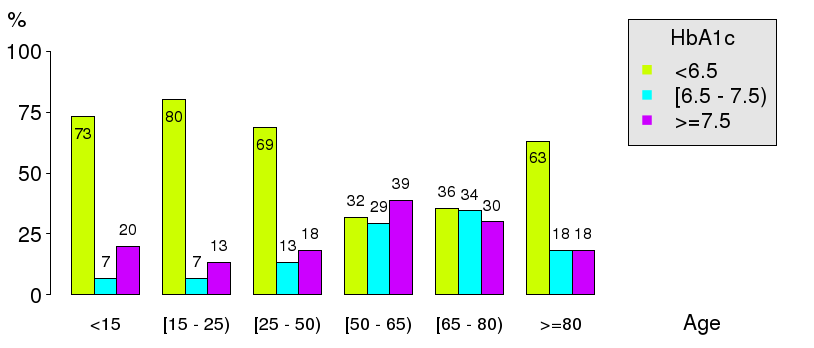
| HbA1c |
Age |
|
| <15 (%) |
[15 - 25) (%) |
[25 - 50) (%) |
[50 - 65) (%) |
[65 - 80) (%) |
>=80 (%) |
|
| <6.5 |
11 ( 73.3) |
48 ( 80.0) |
593 ( 68.4) |
189 ( 31.8) |
167 ( 35.5) |
48 ( 63.2) |
1056 ( 50.7) |
| [6.5 - 7.5) |
1 ( 6.7) |
4 ( 6.7) |
116 ( 13.4) |
174 ( 29.3) |
162 ( 34.5) |
14 ( 18.4) |
471 ( 22.6) |
| >=7.5 |
3 ( 20.0) |
8 ( 13.3) |
158 ( 18.2) |
231 ( 38.9) |
141 ( 30.0) |
14 ( 18.4) |
555 ( 26.7) |
|
15 ( 0.7) |
60 ( 2.9) |
867 ( 41.6) |
594 ( 28.5) |
470 ( 22.6) |
76 ( 3.7) |
2082 (100.0) |
Table 2.2.3.6.22 : HbA1c (by Age, Type of Diabetes = Other Type)
| CMH Chi-Square |
p.value |
df |
| 277.8327 |
0 |
10 |
|
Barplot 2.2.3.6.18 - HbA1c (by Age, Type of Diabetes = Other Type)

|
Barplot 2.2.3.6.18a - HbA1c (by Data Source, Age = <15, Type of Diabetes=Other Type)

|
Barplot 2.2.3.6.18b - HbA1c (by Data Source, Age = [15 - 25), Type of Diabetes=Other Type)
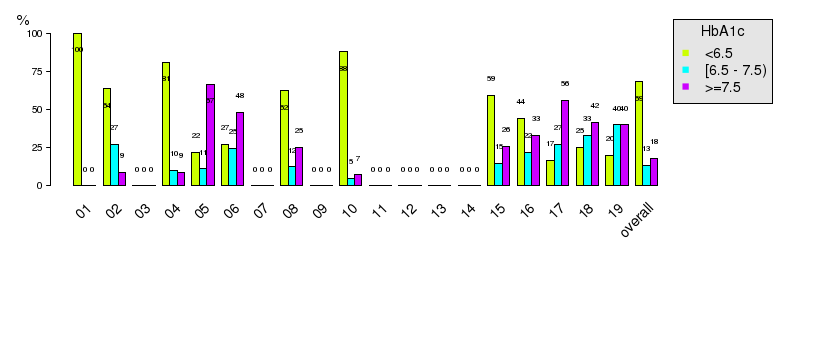
|
Barplot 2.2.3.6.18c - HbA1c (by Data Source, Age = [25 - 50), Type of Diabetes=Other Type)

|
Barplot 2.2.3.6.18d - HbA1c (by Data Source, Age = [50 - 65), Type of Diabetes=Other Type)
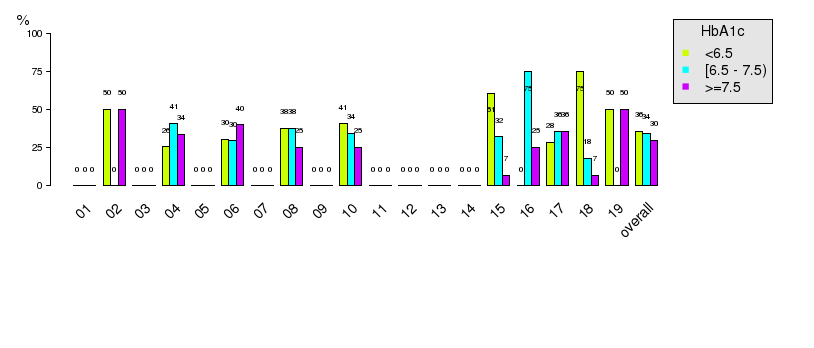
|
Barplot 2.2.3.6.18e - HbA1c (by Data Source, Age = [65 - 80), Type of Diabetes=Other Type)

|
Barplot 2.2.3.6.18f - HbA1c (by Data Source, Age = >=80, Type of Diabetes=Other Type)
| HbA1c |
Gender * Age |
|
| Valid Value |
NV/NA |
|
Valid Value (%) |
NV/NA (%) |
Valid Value (%) |
NV/NA (%) |
|
| Valid Value |
2082 ( 53.8) |
0 ( 0.0) |
0 ( 0.0) |
0 ( 0.0) |
2082 ( 53.8) |
| NV/NA |
1788 ( 46.2) |
0 ( 0.0) |
0 ( 0.0) |
0 ( 0.0) |
1788 ( 46.2) |
|
3870 (100.0) |
0 ( 0.0) |
0 ( 0.0) |
0 ( 0.0) |
3870 (100.0) |
Table 2.2.3.6.23 : HbA1c (by Gender * Age, Type of Diabetes = Other Type)
| HbA1c |
Gender * Age |
|
| <15 |
[15 - 25) |
[25 - 50) |
[50 - 65) |
[65 - 80) |
>=80 |
|
Male (%) |
Female (%) |
Male (%) |
Female (%) |
Male (%) |
Female (%) |
Male (%) |
Female (%) |
Male (%) |
Female (%) |
Male (%) |
Female (%) |
|
| <6.5 |
4 ( 80.0) |
7 ( 70.0) |
45 ( 86.5) |
3 ( 37.5) |
541 ( 81.7) |
52 ( 25.4) |
86 ( 38.2) |
103 ( 27.9) |
79 ( 34.5) |
88 ( 36.5) |
34 ( 68.0) |
14 ( 53.8) |
1056 ( 50.7) |
| [6.5 - 7.5) |
0 ( 0.0) |
1 ( 10.0) |
3 ( 5.8) |
1 ( 12.5) |
71 ( 10.7) |
45 ( 22.0) |
63 ( 28.0) |
111 ( 30.1) |
87 ( 38.0) |
75 ( 31.1) |
9 ( 18.0) |
5 ( 19.2) |
471 ( 22.6) |
| >=7.5 |
1 ( 20.0) |
2 ( 20.0) |
4 ( 7.7) |
4 ( 50.0) |
50 ( 7.6) |
108 ( 52.7) |
76 ( 33.8) |
155 ( 42.0) |
63 ( 27.5) |
78 ( 32.4) |
7 ( 14.0) |
7 ( 26.9) |
555 ( 26.7) |
|
5 ( 0.2) |
10 ( 0.5) |
52 ( 2.5) |
8 ( 0.4) |
662 ( 31.8) |
205 ( 9.8) |
225 ( 10.8) |
369 ( 17.7) |
229 ( 11.0) |
241 ( 11.6) |
50 ( 2.4) |
26 ( 1.2) |
2082 (100.0) |
Table 2.2.3.6.24 : HbA1c (by Gender * Age, Type of Diabetes = Other Type)
| CMH Chi-Square |
p.value |
df |
| 5208.7089 |
0 |
35 |

|
Trellis Barplot: 2.2.3.6.254 - HbA1c * Gender * Age (Type of Diabetes = Type 1)

|
Trellis Barplot: 2.2.3.6.255 - HbA1c * Gender * Age (Type of Diabetes = Type 2)

|
Trellis Barplot: 2.2.3.6.256 - HbA1c * Gender * Age (Type of Diabetes = Other Type)

|
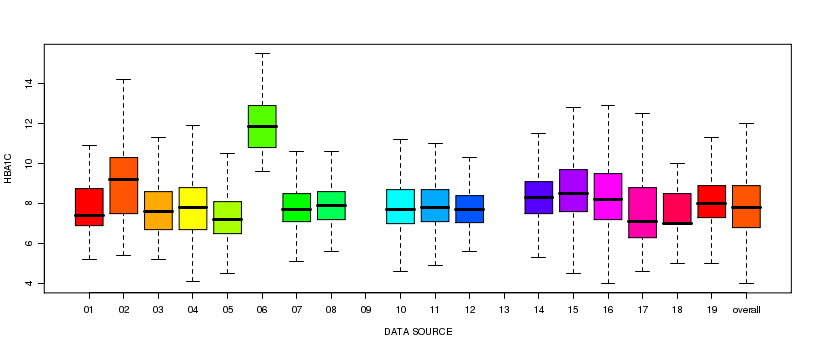
Boxplot: 2.2.3.6.1 - HbA1c (by Type of Diabetes)
|
Boxplot: 2.2.3.6.2 - HbA1c (by Data source, Type of Diabetes = Type 1)

|
Boxplot: 2.2.3.6.3 - HbA1c (by Data source, Type of Diabetes = Type 2)

|
Boxplot: 2.2.3.6.4 - HbA1c (by Data source, Type of Diabetes = Other Type)

|
Boxplot: 2.2.3.6.5 - HbA1c (by Gender)

|
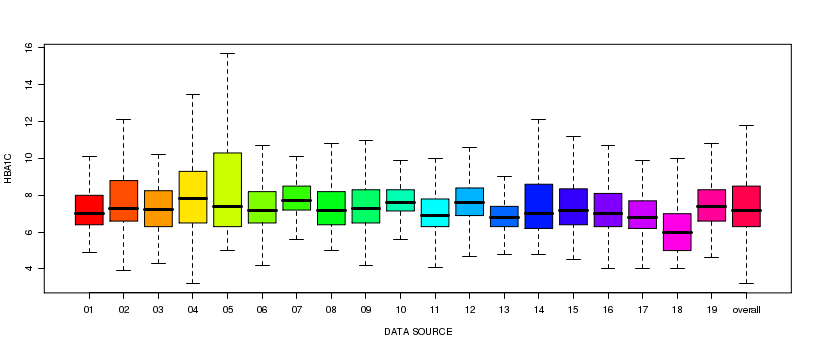
Boxplot: 2.2.3.6.6 - HbA1c (by Data source, Gender = Male)
|
Boxplot: 2.2.3.6.7 - HbA1c (by Data source, Gender = Female)

|
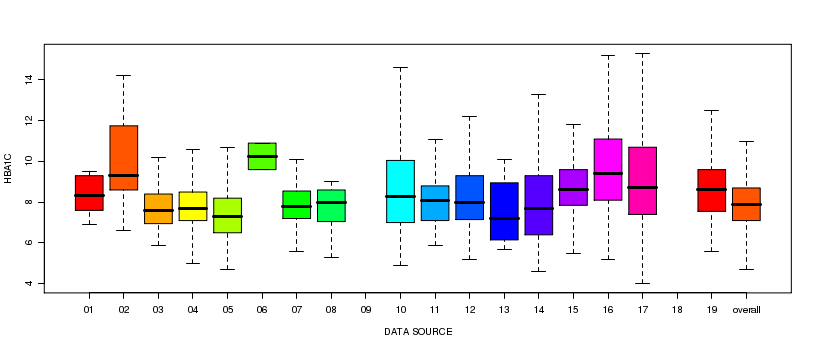
Boxplot: 2.2.3.6.8 - HbA1c (by Age)
|
Boxplot: 2.2.3.6.9 - HbA1c (by Data source, Age = [15 - 25))

|
Boxplot: 2.2.3.6.10 - HbA1c (by Data source, Age = [25 - 50))

|
Boxplot: 2.2.3.6.11 - HbA1c (by Data source, Age = [50 - 65))

|
Boxplot: 2.2.3.6.12 - HbA1c (by Data source, Age = [65 - 80))

|
Boxplot: 2.2.3.6.13 - HbA1c (by Data source, Age = >=80)

|
Boxplot: 2.2.3.6.14 - HbA1c (by Data source, Age = <15)

|
Boxplot: 2.2.3.6.15 - HbA1c (by Gender, Type of Diabetes = Type 1)

|
Boxplot: 2.2.3.6.16 - HbA1c (by Data source, Gender = Male, Type of Diabetes = Type 1)

|
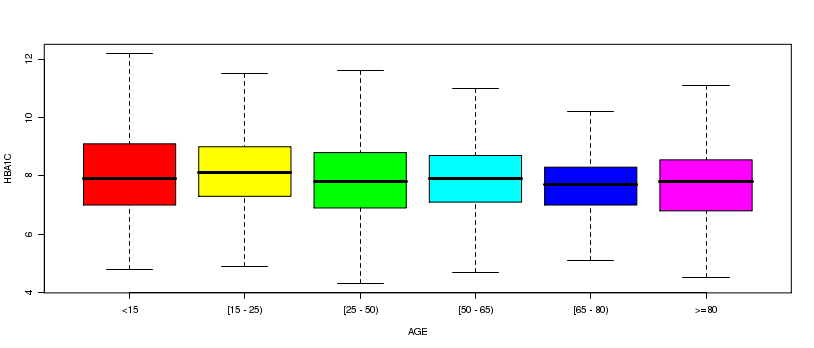
Boxplot: 2.2.3.6.17 - HbA1c (by Data source, Gender = Female, Type of Diabetes = Type 1)
|
Boxplot: 2.2.3.6.18 - HbA1c (by Age, Type of Diabetes = Type 1)

|
Boxplot: 2.2.3.6.19 - HbA1c (by Data source, Age = [15 - 25), Type of Diabetes = Type 1)

|
Boxplot: 2.2.3.6.20 - HbA1c (by Data source, Age = [25 - 50), Type of Diabetes = Type 1)

|
Boxplot: 2.2.3.6.21 - HbA1c (by Data source, Age = [50 - 65), Type of Diabetes = Type 1)

|
Boxplot: 2.2.3.6.22 - HbA1c (by Data source, Age = [65 - 80), Type of Diabetes = Type 1)

|
Boxplot: 2.2.3.6.23 - HbA1c (by Data source, Age = >=80, Type of Diabetes = Type 1)

|
Boxplot: 2.2.3.6.24 - HbA1c (by Data source, Age = <15, Type of Diabetes = Type 1)

|
Boxplot: 2.2.3.6.25 - HbA1c (by Gender, Type of Diabetes = Type 2)

|
Boxplot: 2.2.3.6.26 - HbA1c (by Data source, Gender = Male, Type of Diabetes = Type 2)

|
Boxplot: 2.2.3.6.27 - HbA1c (by Data source, Gender = Female, Type of Diabetes = Type 2)
|
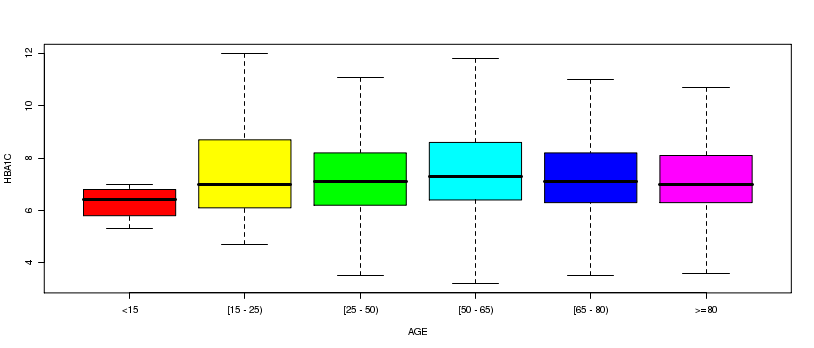
Boxplot: 2.2.3.6.28 - HbA1c (by Age, Type of Diabetes = Type 2)

|
Boxplot: 2.2.3.6.29 - HbA1c (by Data source, Age = [25 - 50), Type of Diabetes = Type 2)

|
Boxplot: 2.2.3.6.30 - HbA1c (by Data source, Age = [50 - 65), Type of Diabetes = Type 2)

|
Boxplot: 2.2.3.6.31 - HbA1c (by Data source, Age = [65 - 80), Type of Diabetes = Type 2)
|
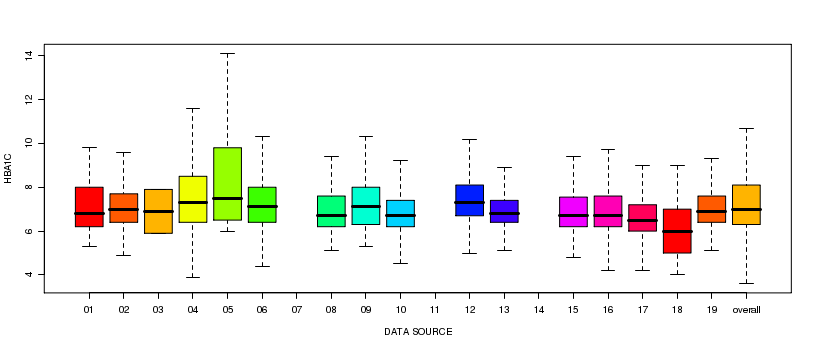
Boxplot: 2.2.3.6.32 - HbA1c (by Data source, Age = >=80, Type of Diabetes = Type 2)

|
Boxplot: 2.2.3.6.33 - HbA1c (by Data source, Age = [15 - 25), Type of Diabetes = Type 2)

|
Boxplot: 2.2.3.6.34 - HbA1c (by Data source, Age = <15, Type of Diabetes = Type 2)

|
Boxplot: 2.2.3.6.35 - HbA1c (by Gender, Type of Diabetes = Other Type)
|
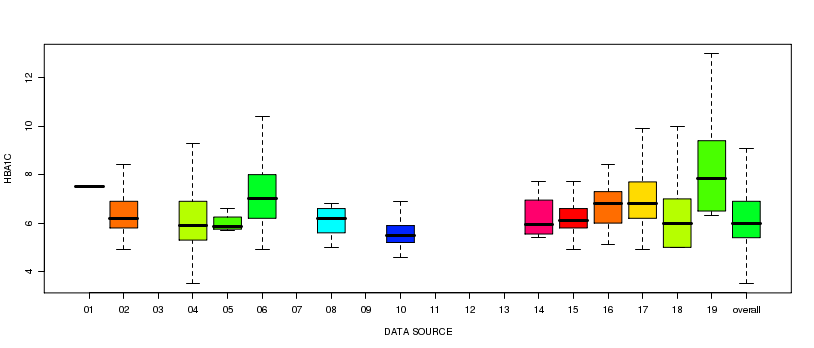
Boxplot: 2.2.3.6.36 - HbA1c (by Data source, Gender = Female, Type of Diabetes = Other Type)
|
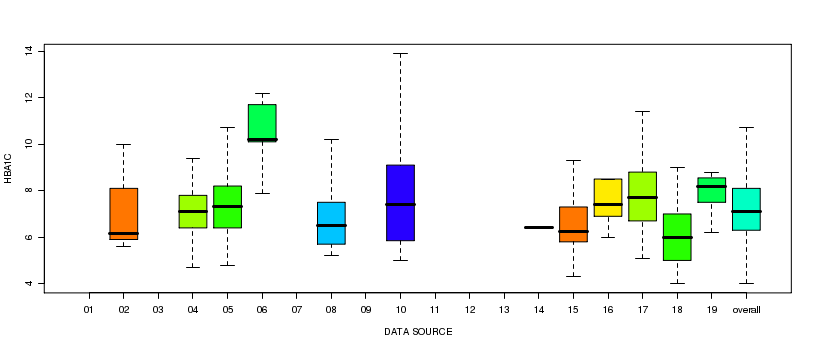
Boxplot: 2.2.3.6.37 - HbA1c (by Data source, Gender = Male, Type of Diabetes = Other Type)

|
Boxplot: 2.2.3.6.38 - HbA1c (by Age, Type of Diabetes = Other Type)

|
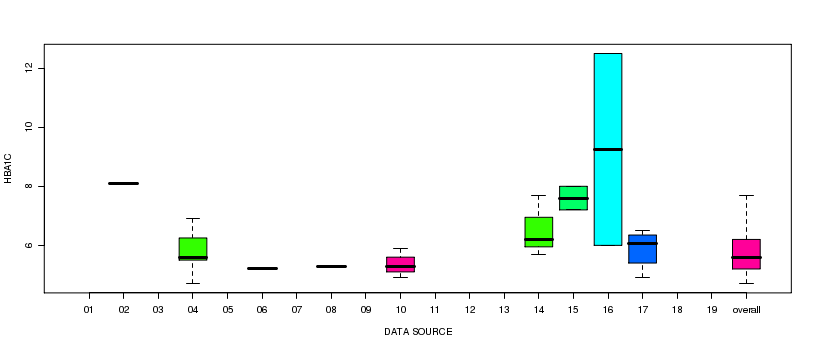
Boxplot: 2.2.3.6.39 - HbA1c (by Data source, Age = [25 - 50), Type of Diabetes = Other Type)
|
Boxplot: 2.2.3.6.40 - HbA1c (by Data source, Age = [15 - 25), Type of Diabetes = Other Type)

|
Boxplot: 2.2.3.6.41 - HbA1c (by Data source, Age = [50 - 65), Type of Diabetes = Other Type)

|
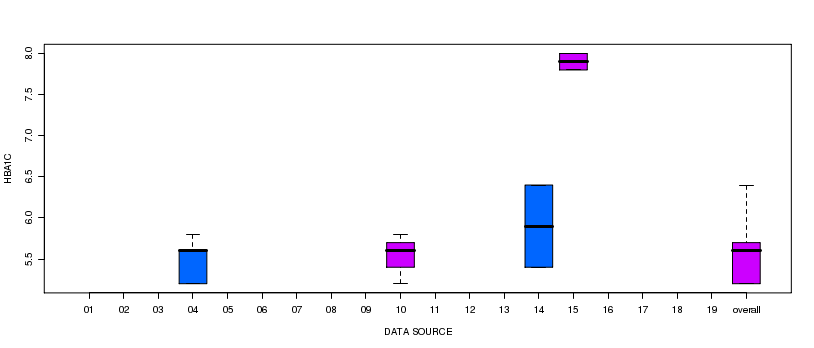
Boxplot: 2.2.3.6.42 - HbA1c (by Data source, Age = [65 - 80), Type of Diabetes = Other Type)
|
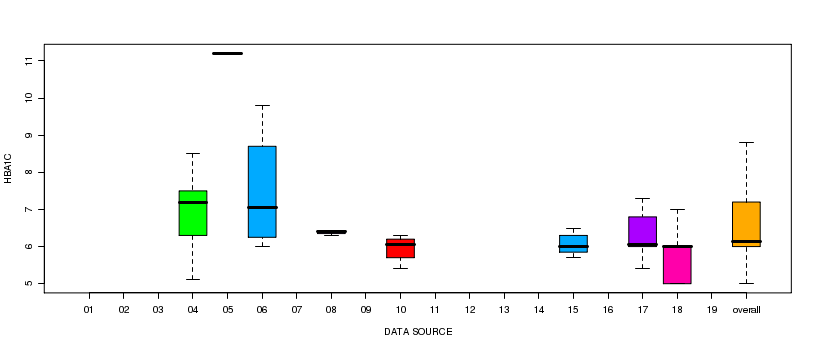
Boxplot: 2.2.3.6.43 - HbA1c (by Data source, Age = <15, Type of Diabetes = Other Type)
|
Boxplot: 2.2.3.6.44 - HbA1c (by Data source, Age = >=80, Type of Diabetes = Other Type)

|
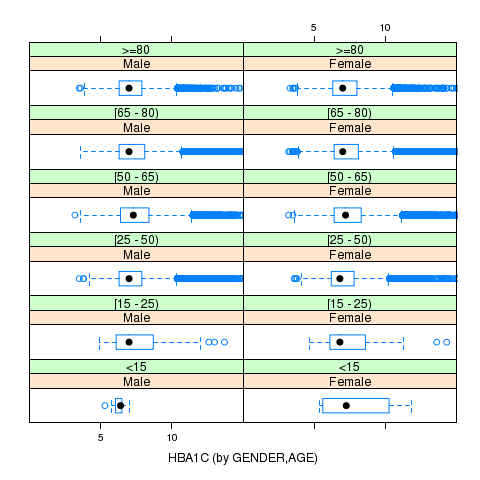
Trellis Boxplot: 2.2.3.6.45 - HbA1c * Gender * Age (Type of Diabetes = Type 1)
|
Trellis Boxplot: 2.2.3.6.46 - HbA1c * Gender * Age (Type of Diabetes = Type 2)

|
Trellis Boxplot: 2.2.3.6.47 - HbA1c * Gender * Age (Type of Diabetes = Other Type)
