| Creatinine |
Valid Value (%) |
NV/NA (%) |
|
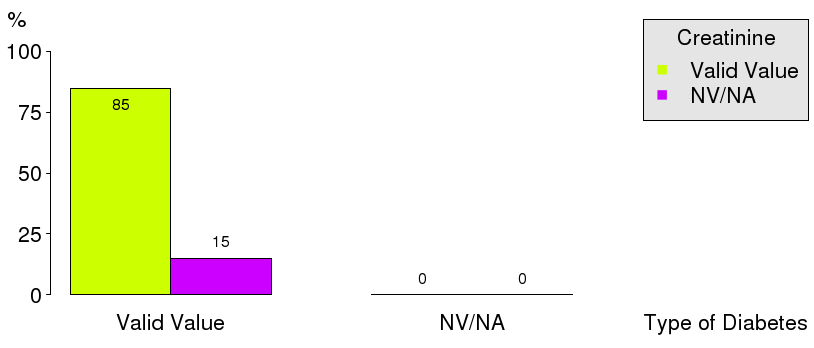
| Valid Value |
138258 ( 84.9) |
0 ( 0.0) |
138258 ( 84.9) |
| NV/NA |
24657 ( 15.1) |
0 ( 0.0) |
24657 ( 15.1) |
|
162915 (100.0) |
0 ( 0.0) |
162915 (100.0) |
Table 2.2.3.5.1 : Creatinine (by Type of Diabetes)
| CMH Chi-Square |
p.value |
df |
| 79214.2357 |
0 |
1 |
|
Barplot 2.2.3.5.1 - Creatinine (by Type of Diabetes)
| Creatinine |
Type 1 (%) |
Type 2 (%) |
Other Type (%) |
|
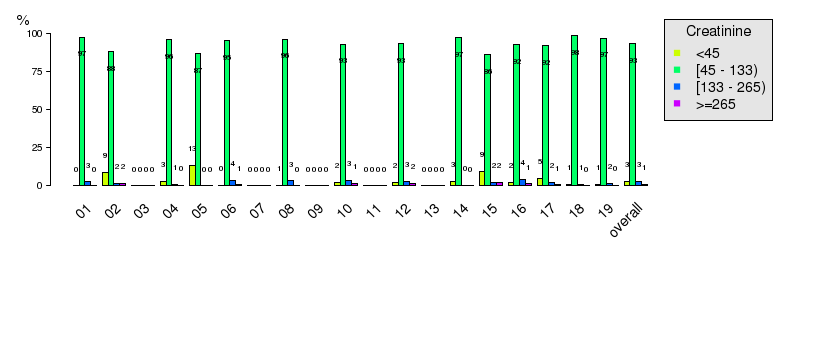
| <45 |
368 ( 2.7) |
1710 ( 1.4) |
105 ( 4.8) |
2183 ( 1.6) |
| [45 - 133) |
12545 ( 93.3) |
113808 ( 92.8) |
1986 ( 91.1) |
128339 ( 92.8) |
| [133 - 265) |
379 ( 2.8) |
6213 ( 5.1) |
78 ( 3.6) |
6670 ( 4.8) |
| >=265 |
150 ( 1.1) |
904 ( 0.7) |
12 ( 0.6) |
1066 ( 0.8) |
|
13442 ( 9.7) |
122635 ( 88.7) |
2181 ( 1.6) |
138258 (100.0) |
Table 2.2.3.5.2 : Creatinine (by Type of Diabetes)
| CMH Chi-Square |
p.value |
df |
| 444.3073 |
0 |
6 |

|
Barplot 2.2.3.5.2 - Creatinine (by Type of Diabetes)
|
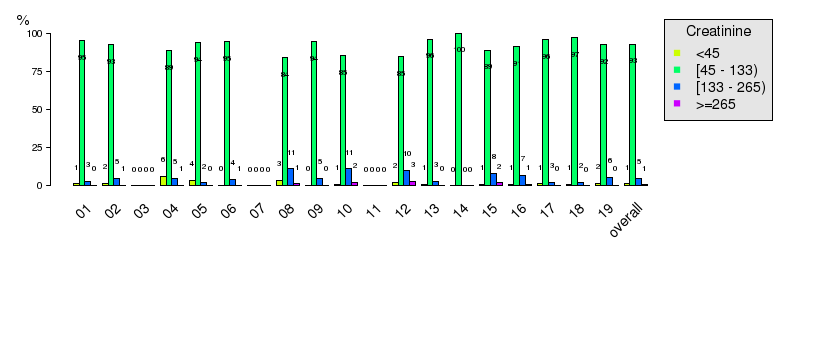
Barplot 2.2.3.5.2a - Creatinine (by Data Source, Type of Diabetes = Type 1)
|
Barplot 2.2.3.5.2b - Creatinine (by Data Source, Type of Diabetes = Type 2)

|
Barplot 2.2.3.5.2c - Creatinine (by Data Source, Type of Diabetes = Other Type)
| Creatinine |
Valid Value (%) |
NV/NA (%) |
|
| Valid Value |
138258 ( 84.9) |
0 ( 0.0) |
138258 ( 84.9) |
| NV/NA |
24657 ( 15.1) |
0 ( 0.0) |
24657 ( 15.1) |
|
162915 (100.0) |
0 ( 0.0) |
162915 (100.0) |
Table 2.2.3.5.3 : Creatinine (by Gender)
| CMH Chi-Square |
p.value |
df |
| 79214.2357 |
0 |
1 |

|
Barplot 2.2.3.5.3 - Creatinine (by Gender)
| Creatinine |
Male (%) |
Female (%) |
|
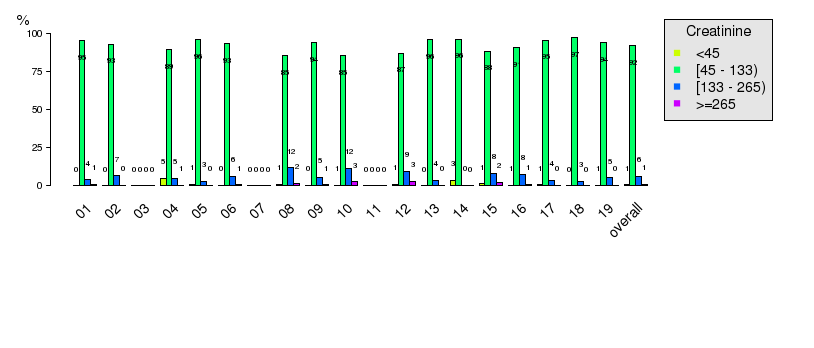
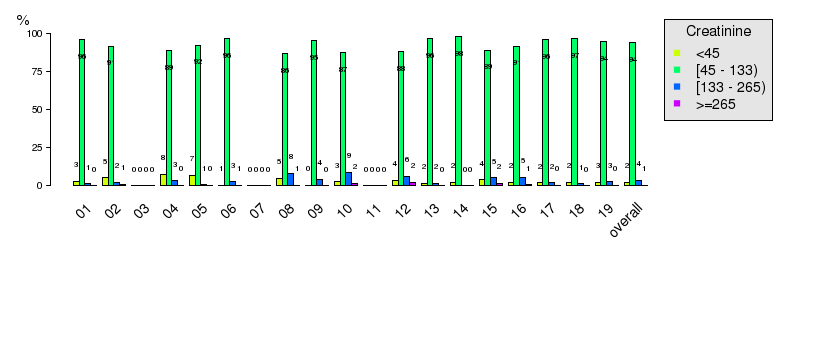
| <45 |
454 ( 0.7) |
1729 ( 2.3) |
2183 ( 1.6) |
| [45 - 133) |
59470 ( 92.0) |
68869 ( 93.6) |
128339 ( 92.8) |
| [133 - 265) |
4073 ( 6.3) |
2597 ( 3.5) |
6670 ( 4.8) |
| >=265 |
650 ( 1.0) |
416 ( 0.6) |
1066 ( 0.8) |
|
64647 ( 46.8) |
73611 ( 53.2) |
138258 (100.0) |
Table 2.2.3.5.4 : Creatinine (by Gender)
| CMH Chi-Square |
p.value |
df |
| 1235.0141 |
0 |
3 |

|
Barplot 2.2.3.5.4 - Creatinine (by Gender)
|
Barplot 2.2.3.5.4a - Creatinine (by Data Source, Gender = Male)
|
Barplot 2.2.3.5.4b - Creatinine (by Data Source, Gender = Female)
| Creatinine |
Valid Value (%) |
NV/NA (%) |
|
| Valid Value |
138258 ( 84.9) |
0 ( 0.0) |
138258 ( 84.9) |
| NV/NA |
24657 ( 15.1) |
0 ( 0.0) |
24657 ( 15.1) |
|
162915 (100.0) |
0 ( 0.0) |
162915 (100.0) |
Table 2.2.3.5.5 : Creatinine (by Age)
| CMH Chi-Square |
p.value |
df |
| 79214.2357 |
0 |
1 |

|
Barplot 2.2.3.5.5 - Creatinine (by Age)
| Creatinine |
<15 (%) |
[15 - 25) (%) |
[25 - 50) (%) |
[50 - 65) (%) |
[65 - 80) (%) |
>=80 (%) |
|
| <45 |
189 ( 25.7) |
57 ( 3.3) |
412 ( 2.6) |
794 ( 1.8) |
611 ( 1.0) |
120 ( 0.7) |
2183 ( 1.6) |
| [45 - 133) |
545 ( 74.0) |
1682 ( 96.3) |
15055 ( 95.5) |
43149 ( 95.4) |
53957 ( 92.3) |
13951 ( 85.6) |
128339 ( 92.8) |
| [133 - 265) |
2 ( 0.3) |
5 ( 0.3) |
210 ( 1.3) |
1005 ( 2.2) |
3437 ( 5.9) |
2011 ( 12.3) |
6670 ( 4.8) |
| >=265 |
0 ( 0.0) |
3 ( 0.2) |
85 ( 0.5) |
277 ( 0.6) |
477 ( 0.8) |
224 ( 1.4) |
1066 ( 0.8) |
|
736 ( 0.5) |
1747 ( 1.3) |
15762 ( 11.4) |
45225 ( 32.7) |
58482 ( 42.3) |
16306 ( 11.8) |
138258 (100.0) |
Table 2.2.3.5.6 : Creatinine (by Age)
| CMH Chi-Square |
p.value |
df |
| 6500.6981 |
0 |
15 |

|
Barplot 2.2.3.5.6 - Creatinine (by Age)

|
Barplot 2.2.3.5.6a - Creatinine (by Data Source, Age = <15)

|
Barplot 2.2.3.5.6b - Creatinine (by Data Source, Age = [15 - 25))

|
Barplot 2.2.3.5.6c - Creatinine (by Data Source, Age = [25 - 50))

|
Barplot 2.2.3.5.6d - Creatinine (by Data Source, Age = [50 - 65))

|
Barplot 2.2.3.5.6e - Creatinine (by Data Source, Age = [65 - 80))

|
Barplot 2.2.3.5.6f - Creatinine (by Data Source, Age = >=80)
| Creatinine |
Gender |
|
| Valid Value (%) |
NV/NA (%) |
|
| Valid Value |
13442 ( 81.9) |
0 ( 0.0) |
13442 ( 81.9) |
| NV/NA |
2975 ( 18.1) |
0 ( 0.0) |
2975 ( 18.1) |
|
16417 (100.0) |
0 ( 0.0) |
16417 (100.0) |
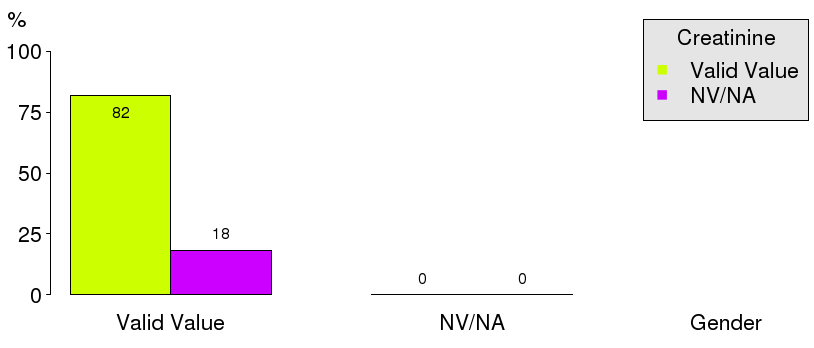
Table 2.2.3.5.7 : Creatinine (by Gender, Type of Diabetes = Type 1)
| CMH Chi-Square |
p.value |
df |
| 6673.4537 |
0 |
1 |
|
Barplot 2.2.3.5.7 - Creatinine (by Gender, Type of Diabetes = Type 1)
| Creatinine |
Gender |
|
| Male (%) |
Female (%) |
|
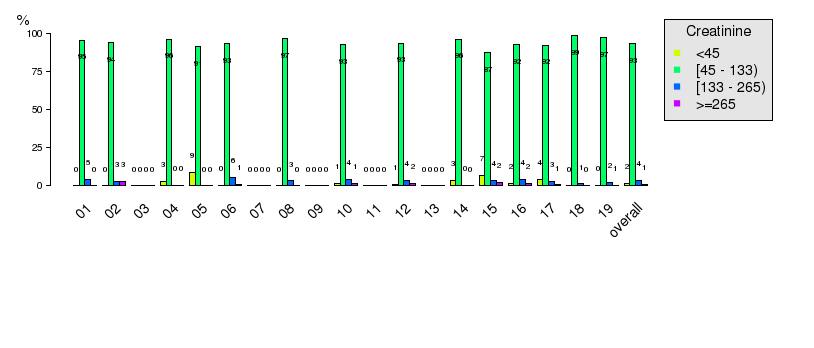
| <45 |
141 ( 1.9) |
227 ( 3.8) |
368 ( 2.7) |
| [45 - 133) |
6907 ( 93.3) |
5638 ( 93.3) |
12545 ( 93.3) |
| [133 - 265) |
260 ( 3.5) |
119 ( 2.0) |
379 ( 2.8) |
| >=265 |
94 ( 1.3) |
56 ( 0.9) |
150 ( 1.1) |
|
7402 ( 55.1) |
6040 ( 44.9) |
13442 (100.0) |
Table 2.2.3.5.8 : Creatinine (by Gender, Type of Diabetes = Type 1)
| CMH Chi-Square |
p.value |
df |
| 73.2967 |
0 |
3 |

|
Barplot 2.2.3.5.8 - Creatinine (by Gender, Type of Diabetes = Type 1)
|
Barplot 2.2.3.5.8a - Creatinine (by Data Source, Gender = Male, Type of Diabetes=Type 1)

|
Barplot 2.2.3.5.8b - Creatinine (by Data Source, Gender = Female, Type of Diabetes=Type 1)
| Creatinine |
Age |
|
| Valid Value (%) |
NV/NA (%) |
|
| Valid Value |
13442 ( 81.9) |
0 ( 0.0) |
13442 ( 81.9) |
| NV/NA |
2975 ( 18.1) |
0 ( 0.0) |
2975 ( 18.1) |
|
16417 (100.0) |
0 ( 0.0) |
16417 (100.0) |
Table 2.2.3.5.9 : Creatinine (by Age, Type of Diabetes = Type 1)
| CMH Chi-Square |
p.value |
df |
| 6673.4537 |
0 |
1 |

|
Barplot 2.2.3.5.9 - Creatinine (by Gender, Type of Diabetes = Type 1)
| Creatinine |
Age |
|
| <15 (%) |
[15 - 25) (%) |
[25 - 50) (%) |
[50 - 65) (%) |
[65 - 80) (%) |
>=80 (%) |
|
| <45 |
181 ( 25.3) |
46 ( 2.8) |
91 ( 1.5) |
37 ( 1.1) |
11 ( 0.8) |
2 ( 0.9) |
368 ( 2.7) |
| [45 - 133) |
534 ( 74.6) |
1571 ( 96.7) |
5921 ( 95.6) |
3088 ( 93.2) |
1250 ( 90.8) |
181 ( 84.6) |
12545 ( 93.3) |
| [133 - 265) |
1 ( 0.1) |
5 ( 0.3) |
130 ( 2.1) |
127 ( 3.8) |
88 ( 6.4) |
28 ( 13.1) |
379 ( 2.8) |
| >=265 |
0 ( 0.0) |
3 ( 0.2) |
53 ( 0.9) |
63 ( 1.9) |
28 ( 2.0) |
3 ( 1.4) |
150 ( 1.1) |
|
716 ( 5.3) |
1625 ( 12.1) |
6195 ( 46.1) |
3315 ( 24.7) |
1377 ( 10.2) |
214 ( 1.6) |
13442 (100.0) |
Table 2.2.3.5.10 : Creatinine (by Age, Type of Diabetes = Type 1)
| CMH Chi-Square |
p.value |
df |
| 1727.2109 |
0 |
15 |

|
Barplot 2.2.3.5.10 - Creatinine (by Age, Type of Diabetes = Type 1)

|
Barplot 2.2.3.5.10a - Creatinine (by Data Source, Age = <15, Type of Diabetes=Type 1)

|
Barplot 2.2.3.5.10b - Creatinine (by Data Source, Age = [15 - 25), Type of Diabetes=Type 1)

|
Barplot 2.2.3.5.10c - Creatinine (by Data Source, Age = [25 - 50), Type of Diabetes=Type 1)

|
Barplot 2.2.3.5.10d - Creatinine (by Data Source, Age = [50 - 65), Type of Diabetes=Type 1)

|
Barplot 2.2.3.5.10e - Creatinine (by Data Source, Age = [65 - 80), Type of Diabetes=Type 1)

|
Barplot 2.2.3.5.10f - Creatinine (by Data Source, Age = >=80, Type of Diabetes=Type 1)
| Creatinine |
Gender * Age |
|
| Valid Value |
NV/NA |
|
Valid Value (%) |
NV/NA (%) |
Valid Value (%) |
NV/NA (%) |
|
| Valid Value |
13442 ( 81.9) |
0 ( 0.0) |
0 ( 0.0) |
0 ( 0.0) |
13442 ( 81.9) |
| NV/NA |
2975 ( 18.1) |
0 ( 0.0) |
0 ( 0.0) |
0 ( 0.0) |
2975 ( 18.1) |
|
16417 (100.0) |
0 ( 0.0) |
0 ( 0.0) |
0 ( 0.0) |
16417 (100.0) |
Table 2.2.3.5.11 : Creatinine (by Gender * Age, Type of Diabetes = Type 1)
| Creatinine |
Gender * Age |
|
| <15 |
[15 - 25) |
[25 - 50) |
[50 - 65) |
[65 - 80) |
>=80 |
|
Male (%) |
Female (%) |
Male (%) |
Female (%) |
Male (%) |
Female (%) |
Male (%) |
Female (%) |
Male (%) |
Female (%) |
Male (%) |
Female (%) |
|
| <45 |
86 ( 24.0) |
95 ( 26.6) |
33 ( 4.5) |
13 ( 1.5) |
72 ( 2.7) |
19 ( 0.5) |
28 ( 1.9) |
9 ( 0.5) |
7 ( 1.0) |
4 ( 0.6) |
1 ( 0.8) |
1 ( 1.1) |
368 ( 2.7) |
| [45 - 133) |
272 ( 75.8) |
262 ( 73.4) |
702 ( 95.1) |
869 ( 98.0) |
2490 ( 94.8) |
3431 ( 96.1) |
1385 ( 94.4) |
1703 ( 92.2) |
683 ( 93.6) |
567 ( 87.6) |
106 ( 88.3) |
75 ( 79.8) |
12545 ( 93.3) |
| [133 - 265) |
1 ( 0.3) |
0 ( 0.0) |
2 ( 0.3) |
3 ( 0.3) |
45 ( 1.7) |
85 ( 2.4) |
31 ( 2.1) |
96 ( 5.2) |
29 ( 4.0) |
59 ( 9.1) |
11 ( 9.2) |
17 ( 18.1) |
379 ( 2.8) |
| >=265 |
0 ( 0.0) |
0 ( 0.0) |
1 ( 0.1) |
2 ( 0.2) |
19 ( 0.7) |
34 ( 1.0) |
23 ( 1.6) |
40 ( 2.2) |
11 ( 1.5) |
17 ( 2.6) |
2 ( 1.7) |
1 ( 1.1) |
150 ( 1.1) |
|
359 ( 2.7) |
357 ( 2.7) |
738 ( 5.5) |
887 ( 6.6) |
2626 ( 19.5) |
3569 ( 26.6) |
1467 ( 10.9) |
1848 ( 13.7) |
730 ( 5.4) |
647 ( 4.8) |
120 ( 0.9) |
94 ( 0.7) |
13442 (100.0) |
Table 2.2.3.5.12 : Creatinine (by Gender * Age, Type of Diabetes = Type 1)
| CMH Chi-Square |
p.value |
df |
| 75966.5594 |
0 |
47 |
| Creatinine |
Gender |
|
| Valid Value (%) |
NV/NA (%) |
|
| Valid Value |
122635 ( 85.4) |
0 ( 0.0) |
122635 ( 85.4) |
| NV/NA |
20947 ( 14.6) |
0 ( 0.0) |
20947 ( 14.6) |
|
143582 (100.0) |
0 ( 0.0) |
143582 (100.0) |
Table 2.2.3.5.13 : Creatinine (by Gender, Type of Diabetes = Type 2)
| CMH Chi-Square |
p.value |
df |
| 72017.7275 |
0 |
1 |

|
Barplot 2.2.3.5.11 - Creatinine (by Gender, Type of Diabetes = Type 2)
| Creatinine |
Gender |
|
| Male (%) |
Female (%) |
|
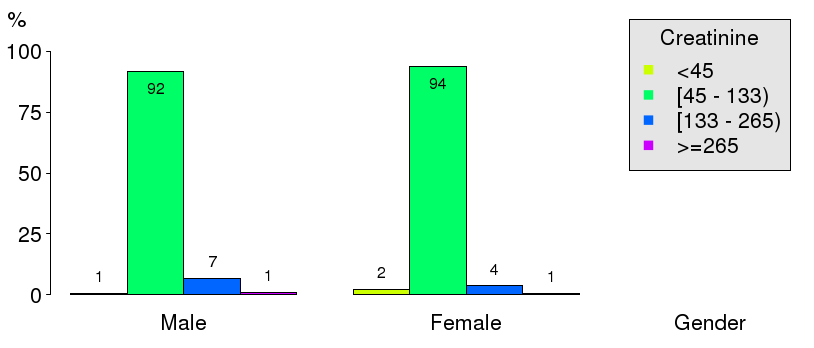
| <45 |
298 ( 0.5) |
1412 ( 2.1) |
1710 ( 1.4) |
| [45 - 133) |
51510 ( 91.8) |
62298 ( 93.6) |
113808 ( 92.8) |
| [133 - 265) |
3755 ( 6.7) |
2458 ( 3.7) |
6213 ( 5.1) |
| >=265 |
549 ( 1.0) |
355 ( 0.5) |
904 ( 0.7) |
|
56112 ( 45.8) |
66523 ( 54.2) |
122635 (100.0) |
Table 2.2.3.5.14 : Creatinine (by Gender, Type of Diabetes = Type 2)
| CMH Chi-Square |
p.value |
df |
| 1185.4354 |
0 |
3 |
|
Barplot 2.2.3.5.12 - Creatinine (by Gender, Type of Diabetes = Type 2)

|
Barplot 2.2.3.5.12a - Creatinine (by Data Source, Gender = Male, Type of Diabetes=Type 2)

|
Barplot 2.2.3.5.12b - Creatinine (by Data Source, Gender = Female, Type of Diabetes=Type 2)
| Creatinine |
Age |
|
| Valid Value (%) |
NV/NA (%) |
|
| Valid Value |
122635 ( 85.4) |
0 ( 0.0) |
122635 ( 85.4) |
| NV/NA |
20947 ( 14.6) |
0 ( 0.0) |
20947 ( 14.6) |
|
143582 (100.0) |
0 ( 0.0) |
143582 (100.0) |
Table 2.2.3.5.15 : Creatinine (by Age, Type of Diabetes = Type 2)
| CMH Chi-Square |
p.value |
df |
| 72017.7275 |
0 |
1 |

|
Barplot 2.2.3.5.13 - Creatinine (by Gender, Type of Diabetes = Type 2)
| Creatinine |
Age |
|
| <15 (%) |
[15 - 25) (%) |
[25 - 50) (%) |
[50 - 65) (%) |
[65 - 80) (%) |
>=80 (%) |
|
| <45 |
1 ( 10.0) |
9 ( 10.3) |
261 ( 2.9) |
732 ( 1.8) |
589 ( 1.0) |
118 ( 0.7) |
1710 ( 1.4) |
| [45 - 133) |
8 ( 80.0) |
78 ( 89.7) |
8708 ( 96.0) |
39370 ( 95.6) |
52048 ( 92.3) |
13596 ( 85.5) |
113808 ( 92.8) |
| [133 - 265) |
1 ( 10.0) |
0 ( 0.0) |
73 ( 0.8) |
858 ( 2.1) |
3315 ( 5.9) |
1966 ( 12.4) |
6213 ( 5.1) |
| >=265 |
0 ( 0.0) |
0 ( 0.0) |
28 ( 0.3) |
213 ( 0.5) |
443 ( 0.8) |
220 ( 1.4) |
904 ( 0.7) |
|
10 ( 0.0) |
87 ( 0.1) |
9070 ( 7.4) |
41173 ( 33.6) |
56395 ( 46.0) |
15900 ( 13.0) |
122635 (100.0) |
Table 2.2.3.5.16 : Creatinine (by Age, Type of Diabetes = Type 2)
| CMH Chi-Square |
p.value |
df |
| 3418.3806 |
0 |
15 |

|
Barplot 2.2.3.5.14 - Creatinine (by Age, Type of Diabetes = Type 2)

|
Barplot 2.2.3.5.14a - Creatinine (by Data Source, Age = <15, Type of Diabetes=Type 2)

|
Barplot 2.2.3.5.14b - Creatinine (by Data Source, Age = [15 - 25), Type of Diabetes=Type 2)

|
Barplot 2.2.3.5.14c - Creatinine (by Data Source, Age = [25 - 50), Type of Diabetes=Type 2)

|
Barplot 2.2.3.5.14d - Creatinine (by Data Source, Age = [50 - 65), Type of Diabetes=Type 2)

|
Barplot 2.2.3.5.14e - Creatinine (by Data Source, Age = [65 - 80), Type of Diabetes=Type 2)

|
Barplot 2.2.3.5.14f - Creatinine (by Data Source, Age = >=80, Type of Diabetes=Type 2)
| Creatinine |
Gender * Age |
|
| Valid Value |
NV/NA |
|
Valid Value (%) |
NV/NA (%) |
Valid Value (%) |
NV/NA (%) |
|
| Valid Value |
122635 ( 85.4) |
0 ( 0.0) |
0 ( 0.0) |
0 ( 0.0) |
122635 ( 85.4) |
| NV/NA |
20947 ( 14.6) |
0 ( 0.0) |
0 ( 0.0) |
0 ( 0.0) |
20947 ( 14.6) |
|
143582 (100.0) |
0 ( 0.0) |
0 ( 0.0) |
0 ( 0.0) |
143582 (100.0) |
Table 2.2.3.5.17 : Creatinine (by Gender * Age, Type of Diabetes = Type 2)
| Creatinine |
Gender * Age |
|
| <15 |
[15 - 25) |
[25 - 50) |
[50 - 65) |
[65 - 80) |
>=80 |
|
Male (%) |
Female (%) |
Male (%) |
Female (%) |
Male (%) |
Female (%) |
Male (%) |
Female (%) |
Male (%) |
Female (%) |
Male (%) |
Female (%) |
|
| <45 |
1 ( 25.0) |
0 ( 0.0) |
8 ( 16.3) |
1 ( 2.6) |
219 ( 5.8) |
42 ( 0.8) |
606 ( 3.1) |
126 ( 0.6) |
474 ( 1.5) |
115 ( 0.5) |
104 ( 1.0) |
14 ( 0.3) |
1710 ( 1.4) |
| [45 - 133) |
2 ( 50.0) |
6 (100.0) |
41 ( 83.7) |
37 ( 97.4) |
3547 ( 93.3) |
5161 ( 97.9) |
18899 ( 95.4) |
20471 ( 95.9) |
30536 ( 94.3) |
21512 ( 89.6) |
9273 ( 88.6) |
4323 ( 79.5) |
113808 ( 92.8) |
| [133 - 265) |
1 ( 25.0) |
0 ( 0.0) |
0 ( 0.0) |
0 ( 0.0) |
22 ( 0.6) |
51 ( 1.0) |
238 ( 1.2) |
620 ( 2.9) |
1207 ( 3.7) |
2108 ( 8.8) |
990 ( 9.5) |
976 ( 18.0) |
6213 ( 5.1) |
| >=265 |
0 ( 0.0) |
0 ( 0.0) |
0 ( 0.0) |
0 ( 0.0) |
12 ( 0.3) |
16 ( 0.3) |
73 ( 0.4) |
140 ( 0.7) |
174 ( 0.5) |
269 ( 1.1) |
96 ( 0.9) |
124 ( 2.3) |
904 ( 0.7) |
|
4 ( 0.0) |
6 ( 0.0) |
49 ( 0.0) |
38 ( 0.0) |
3800 ( 3.1) |
5270 ( 4.3) |
19816 ( 16.2) |
21357 ( 17.4) |
32391 ( 26.4) |
24004 ( 19.6) |
10463 ( 8.5) |
5437 ( 4.4) |
122635 (100.0) |
Table 2.2.3.5.18 : Creatinine (by Gender * Age, Type of Diabetes = Type 2)
| CMH Chi-Square |
p.value |
df |
| 787169.7062 |
0 |
47 |
| Creatinine |
Gender |
|
| Valid Value (%) |
NV/NA (%) |
|
| Valid Value |
2181 ( 74.8) |
0 ( 0.0) |
2181 ( 74.8) |
| NV/NA |
735 ( 25.2) |
0 ( 0.0) |
735 ( 25.2) |
|
2916 (100.0) |
0 ( 0.0) |
2916 (100.0) |
Table 2.2.3.5.19 : Creatinine (by Gender, Type of Diabetes = Other Type)
| CMH Chi-Square |
p.value |
df |
| 717.0494 |
0 |
1 |

|
Barplot 2.2.3.5.15 - Creatinine (by Gender, Type of Diabetes = Other Type)
| Creatinine |
Gender |
|
| Male (%) |
Female (%) |
|
| <45 |
15 ( 1.3) |
90 ( 8.6) |
105 ( 4.8) |
| [45 - 133) |
1053 ( 92.9) |
933 ( 89.0) |
1986 ( 91.1) |
| [133 - 265) |
58 ( 5.1) |
20 ( 1.9) |
78 ( 3.6) |
| >=265 |
7 ( 0.6) |
5 ( 0.5) |
12 ( 0.6) |
|
1133 ( 51.9) |
1048 ( 48.1) |
2181 (100.0) |
Table 2.2.3.5.20 : Creatinine (by Gender, Type of Diabetes = Other Type)
| CMH Chi-Square |
p.value |
df |
| 76.4718 |
0 |
3 |

|
Barplot 2.2.3.5.16 - Creatinine (by Gender, Type of Diabetes = Other Type)

|
Barplot 2.2.3.5.16a - Creatinine (by Data Source, Gender = Male, Type of Diabetes=Other Type)
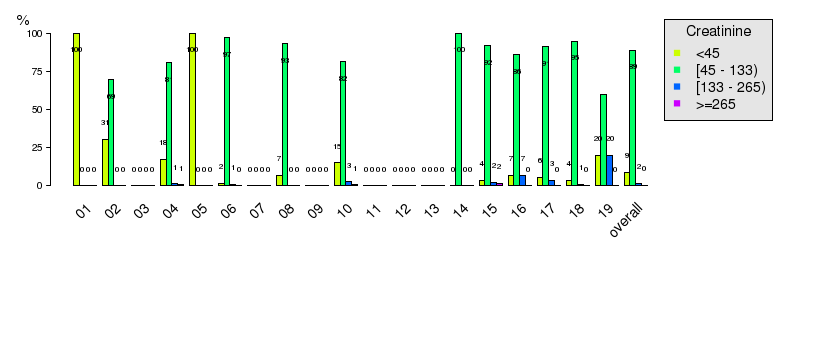
|
Barplot 2.2.3.5.16b - Creatinine (by Data Source, Gender = Female, Type of Diabetes=Other Type)
| Creatinine |
Age |
|
| Valid Value (%) |
NV/NA (%) |
|
| Valid Value |
2181 ( 74.8) |
0 ( 0.0) |
2181 ( 74.8) |
| NV/NA |
735 ( 25.2) |
0 ( 0.0) |
735 ( 25.2) |
|
2916 (100.0) |
0 ( 0.0) |
2916 (100.0) |
Table 2.2.3.5.21 : Creatinine (by Age, Type of Diabetes = Other Type)
| CMH Chi-Square |
p.value |
df |
| 717.0494 |
0 |
1 |

|
Barplot 2.2.3.5.17 - Creatinine (by Gender, Type of Diabetes = Other Type)
| Creatinine |
Age |
|
| <15 (%) |
[15 - 25) (%) |
[25 - 50) (%) |
[50 - 65) (%) |
[65 - 80) (%) |
>=80 (%) |
|
| <45 |
7 ( 70.0) |
2 ( 5.7) |
60 ( 12.1) |
25 ( 3.4) |
11 ( 1.5) |
0 ( 0.0) |
105 ( 4.8) |
| [45 - 133) |
3 ( 30.0) |
33 ( 94.3) |
426 ( 85.7) |
691 ( 93.8) |
659 ( 92.8) |
174 ( 90.6) |
1986 ( 91.1) |
| [133 - 265) |
0 ( 0.0) |
0 ( 0.0) |
7 ( 1.4) |
20 ( 2.7) |
34 ( 4.8) |
17 ( 8.9) |
78 ( 3.6) |
| >=265 |
0 ( 0.0) |
0 ( 0.0) |
4 ( 0.8) |
1 ( 0.1) |
6 ( 0.8) |
1 ( 0.5) |
12 ( 0.6) |
|
10 ( 0.5) |
35 ( 1.6) |
497 ( 22.8) |
737 ( 33.8) |
710 ( 32.6) |
192 ( 8.8) |
2181 (100.0) |
Table 2.2.3.5.22 : Creatinine (by Age, Type of Diabetes = Other Type)
| CMH Chi-Square |
p.value |
df |
| 209.1003 |
0 |
15 |

|
Barplot 2.2.3.5.18 - Creatinine (by Age, Type of Diabetes = Other Type)

|
Barplot 2.2.3.5.18a - Creatinine (by Data Source, Age = <15, Type of Diabetes=Other Type)

|
Barplot 2.2.3.5.18b - Creatinine (by Data Source, Age = [15 - 25), Type of Diabetes=Other Type)

|
Barplot 2.2.3.5.18c - Creatinine (by Data Source, Age = [25 - 50), Type of Diabetes=Other Type)
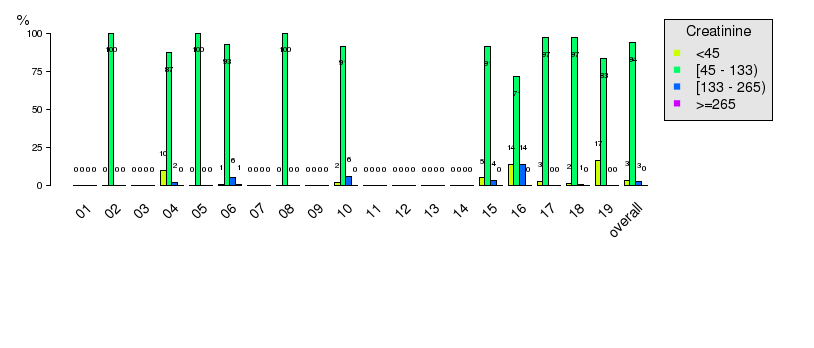
|
Barplot 2.2.3.5.18d - Creatinine (by Data Source, Age = [50 - 65), Type of Diabetes=Other Type)

|
Barplot 2.2.3.5.18e - Creatinine (by Data Source, Age = [65 - 80), Type of Diabetes=Other Type)

|
Barplot 2.2.3.5.18f - Creatinine (by Data Source, Age = >=80, Type of Diabetes=Other Type)
| Creatinine |
Gender * Age |
|
| Valid Value |
NV/NA |
|
Valid Value (%) |
NV/NA (%) |
Valid Value (%) |
NV/NA (%) |
|
| Valid Value |
2181 ( 74.8) |
0 ( 0.0) |
0 ( 0.0) |
0 ( 0.0) |
2181 ( 74.8) |
| NV/NA |
735 ( 25.2) |
0 ( 0.0) |
0 ( 0.0) |
0 ( 0.0) |
735 ( 25.2) |
|
2916 (100.0) |
0 ( 0.0) |
0 ( 0.0) |
0 ( 0.0) |
2916 (100.0) |
Table 2.2.3.5.23 : Creatinine (by Gender * Age, Type of Diabetes = Other Type)
| Creatinine |
Gender * Age |
|
| <15 |
[15 - 25) |
[25 - 50) |
[50 - 65) |
[65 - 80) |
>=80 |
|
Male (%) |
Female (%) |
Male (%) |
Female (%) |
Male (%) |
Female (%) |
Male (%) |
Female (%) |
Male (%) |
Female (%) |
Male (%) |
Female (%) |
|
| <45 |
4 ( 66.7) |
3 ( 75.0) |
2 ( 7.1) |
0 ( 0.0) |
56 ( 20.1) |
4 ( 1.8) |
18 ( 6.2) |
7 ( 1.6) |
10 ( 3.0) |
1 ( 0.3) |
0 ( 0.0) |
0 ( 0.0) |
105 ( 4.8) |
| [45 - 133) |
2 ( 33.3) |
1 ( 25.0) |
26 ( 92.9) |
7 (100.0) |
219 ( 78.5) |
207 ( 95.0) |
268 ( 92.4) |
423 ( 94.6) |
309 ( 93.4) |
350 ( 92.3) |
109 ( 95.6) |
65 ( 83.3) |
1986 ( 91.1) |
| [133 - 265) |
0 ( 0.0) |
0 ( 0.0) |
0 ( 0.0) |
0 ( 0.0) |
3 ( 1.1) |
4 ( 1.8) |
4 ( 1.4) |
16 ( 3.6) |
9 ( 2.7) |
25 ( 6.6) |
4 ( 3.5) |
13 ( 16.7) |
78 ( 3.6) |
| >=265 |
0 ( 0.0) |
0 ( 0.0) |
0 ( 0.0) |
0 ( 0.0) |
1 ( 0.4) |
3 ( 1.4) |
0 ( 0.0) |
1 ( 0.2) |
3 ( 0.9) |
3 ( 0.8) |
1 ( 0.9) |
0 ( 0.0) |
12 ( 0.6) |
|
6 ( 0.3) |
4 ( 0.2) |
28 ( 1.3) |
7 ( 0.3) |
279 ( 12.8) |
218 ( 10.0) |
290 ( 13.3) |
447 ( 20.5) |
331 ( 15.2) |
379 ( 17.4) |
114 ( 5.2) |
78 ( 3.6) |
2181 (100.0) |
Table 2.2.3.5.24 : Creatinine (by Gender * Age, Type of Diabetes = Other Type)
| CMH Chi-Square |
p.value |
df |
| 10611.3631 |
0 |
47 |

|
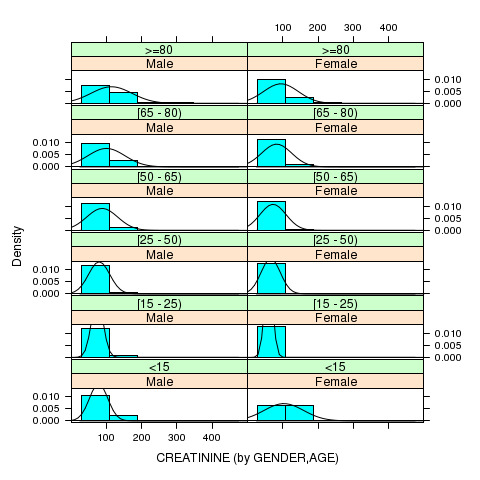
Trellis Barplot: 2.2.3.5.254 - Creatinine * Gender * Age (Type of Diabetes = Type 1)
|
Trellis Barplot: 2.2.3.5.255 - Creatinine * Gender * Age (Type of Diabetes = Type 2)

|
Trellis Barplot: 2.2.3.5.256 - Creatinine * Gender * Age (Type of Diabetes = Other Type)

|
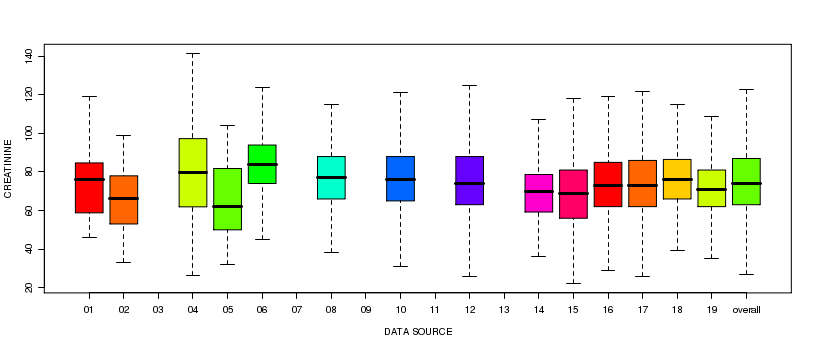
Boxplot: 2.2.3.5.1 - Creatinine (by Type of Diabetes)
|
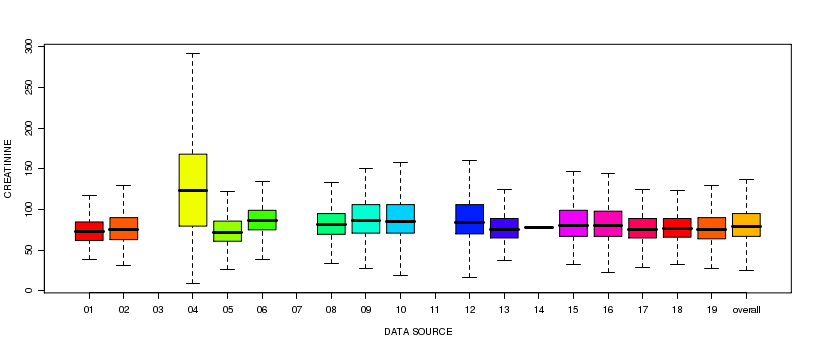
Boxplot: 2.2.3.5.2 - Creatinine (by Data source, Type of Diabetes = Type 1)
|
Boxplot: 2.2.3.5.3 - Creatinine (by Data source, Type of Diabetes = Type 2)

|
Boxplot: 2.2.3.5.4 - Creatinine (by Data source, Type of Diabetes = Other Type)

|
Boxplot: 2.2.3.5.5 - Creatinine (by Gender)

|
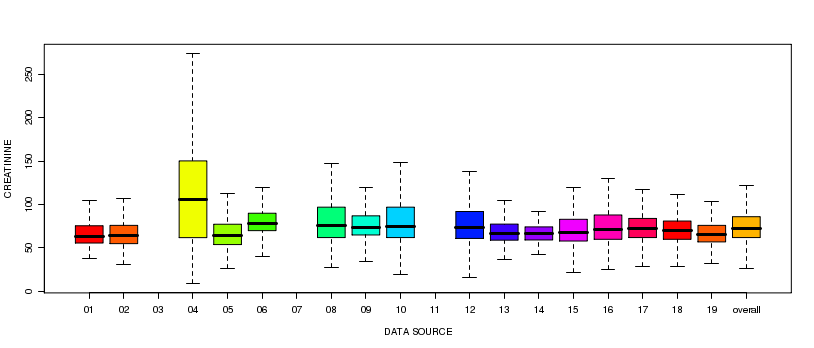
Boxplot: 2.2.3.5.6 - Creatinine (by Data source, Gender = Male)
|
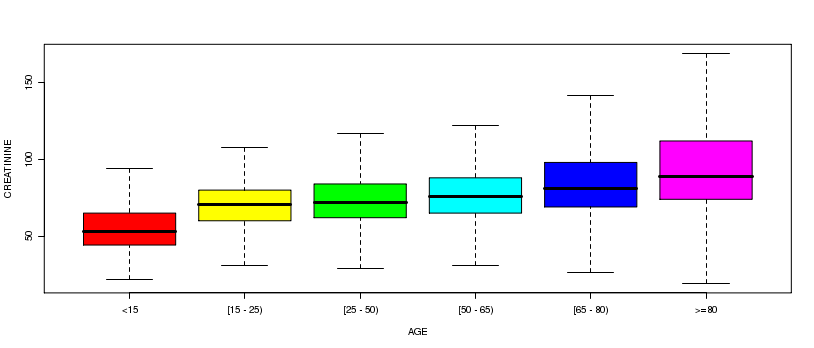
Boxplot: 2.2.3.5.7 - Creatinine (by Data source, Gender = Female)
|
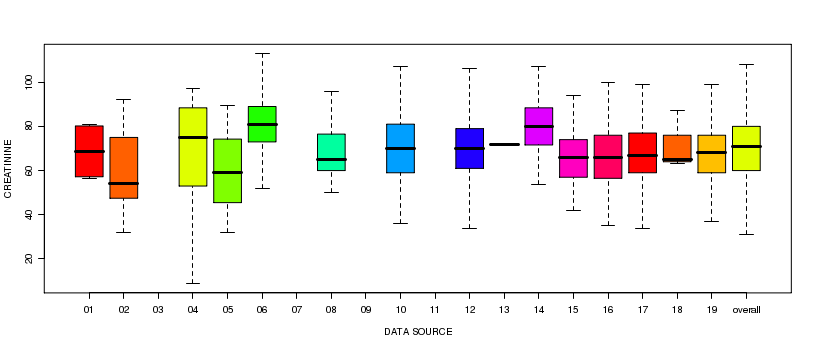
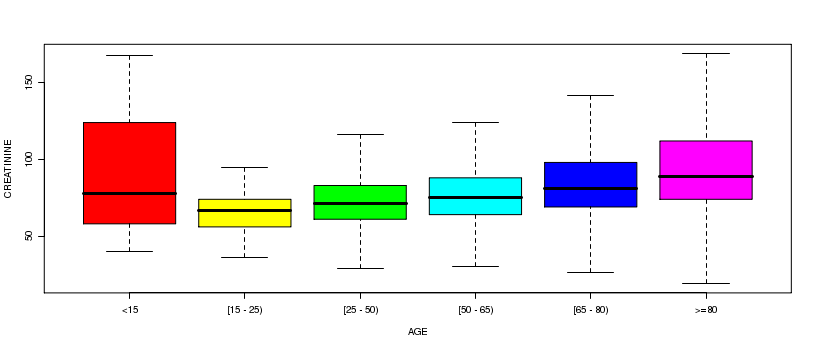
Boxplot: 2.2.3.5.8 - Creatinine (by Age)
|
Boxplot: 2.2.3.5.9 - Creatinine (by Data source, Age = [15 - 25))

|
Boxplot: 2.2.3.5.10 - Creatinine (by Data source, Age = [25 - 50))

|
Boxplot: 2.2.3.5.11 - Creatinine (by Data source, Age = [50 - 65))

|
Boxplot: 2.2.3.5.12 - Creatinine (by Data source, Age = [65 - 80))

|
Boxplot: 2.2.3.5.13 - Creatinine (by Data source, Age = >=80)

|
Boxplot: 2.2.3.5.14 - Creatinine (by Data source, Age = <15)

|
Boxplot: 2.2.3.5.15 - Creatinine (by Gender, Type of Diabetes = Type 1)

|
Boxplot: 2.2.3.5.16 - Creatinine (by Data source, Gender = Male, Type of Diabetes = Type 1)

|
Boxplot: 2.2.3.5.17 - Creatinine (by Data source, Gender = Female, Type of Diabetes = Type 1)

|
Boxplot: 2.2.3.5.18 - Creatinine (by Age, Type of Diabetes = Type 1)

|
Boxplot: 2.2.3.5.19 - Creatinine (by Data source, Age = [15 - 25), Type of Diabetes = Type 1)

|
Boxplot: 2.2.3.5.20 - Creatinine (by Data source, Age = [25 - 50), Type of Diabetes = Type 1)

|
Boxplot: 2.2.3.5.21 - Creatinine (by Data source, Age = [50 - 65), Type of Diabetes = Type 1)

|
Boxplot: 2.2.3.5.22 - Creatinine (by Data source, Age = [65 - 80), Type of Diabetes = Type 1)

|
Boxplot: 2.2.3.5.23 - Creatinine (by Data source, Age = >=80, Type of Diabetes = Type 1)

|
Boxplot: 2.2.3.5.24 - Creatinine (by Data source, Age = <15, Type of Diabetes = Type 1)

|
Boxplot: 2.2.3.5.25 - Creatinine (by Gender, Type of Diabetes = Type 2)

|
Boxplot: 2.2.3.5.26 - Creatinine (by Data source, Gender = Male, Type of Diabetes = Type 2)

|
Boxplot: 2.2.3.5.27 - Creatinine (by Data source, Gender = Female, Type of Diabetes = Type 2)
|
Boxplot: 2.2.3.5.28 - Creatinine (by Age, Type of Diabetes = Type 2)

|
Boxplot: 2.2.3.5.29 - Creatinine (by Data source, Age = [25 - 50), Type of Diabetes = Type 2)

|
Boxplot: 2.2.3.5.30 - Creatinine (by Data source, Age = [50 - 65), Type of Diabetes = Type 2)

|
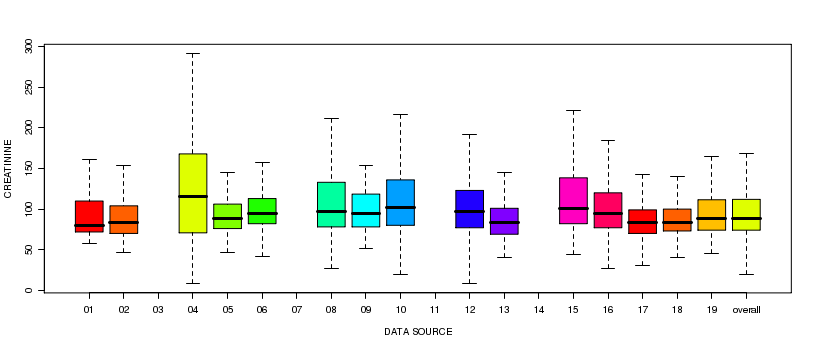
Boxplot: 2.2.3.5.31 - Creatinine (by Data source, Age = [65 - 80), Type of Diabetes = Type 2)
|
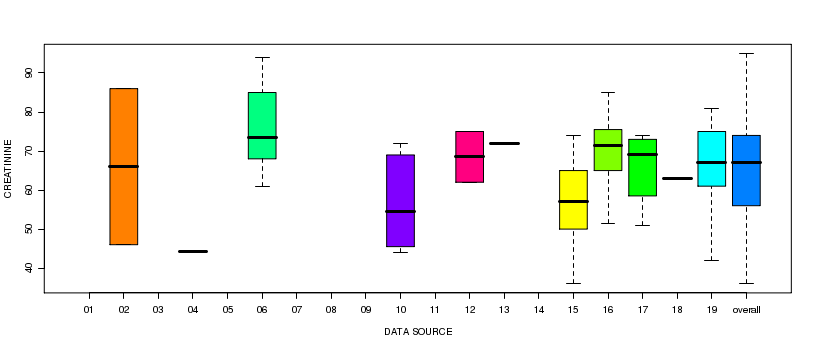
Boxplot: 2.2.3.5.32 - Creatinine (by Data source, Age = >=80, Type of Diabetes = Type 2)
|
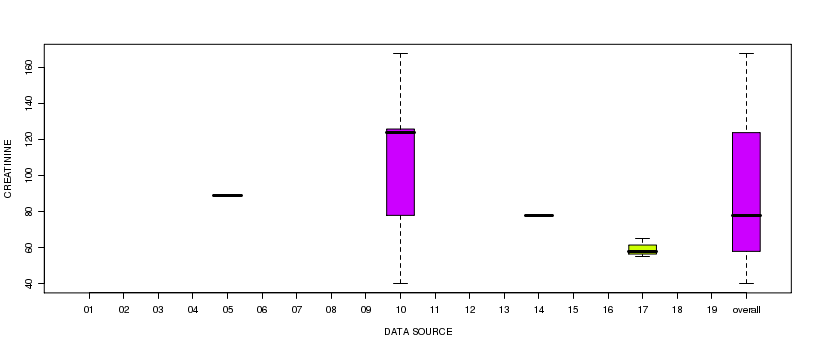
Boxplot: 2.2.3.5.33 - Creatinine (by Data source, Age = [15 - 25), Type of Diabetes = Type 2)
|
Boxplot: 2.2.3.5.34 - Creatinine (by Data source, Age = <15, Type of Diabetes = Type 2)

|
Boxplot: 2.2.3.5.35 - Creatinine (by Gender, Type of Diabetes = Other Type)

|
Boxplot: 2.2.3.5.36 - Creatinine (by Data source, Gender = Female, Type of Diabetes = Other Type)

|
Boxplot: 2.2.3.5.37 - Creatinine (by Data source, Gender = Male, Type of Diabetes = Other Type)

|
Boxplot: 2.2.3.5.38 - Creatinine (by Age, Type of Diabetes = Other Type)

|
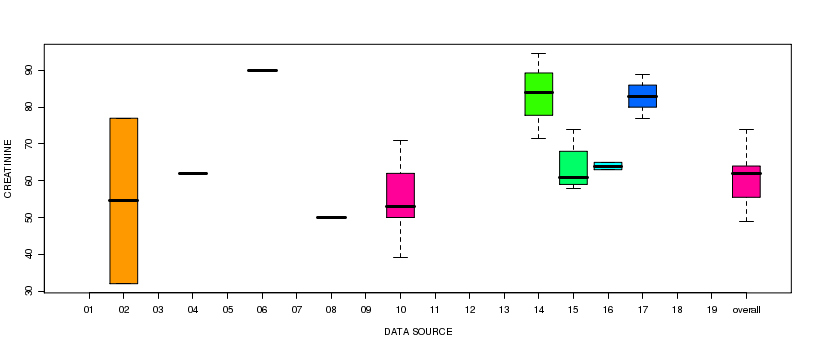
Boxplot: 2.2.3.5.39 - Creatinine (by Data source, Age = [25 - 50), Type of Diabetes = Other Type)
|
Boxplot: 2.2.3.5.40 - Creatinine (by Data source, Age = [15 - 25), Type of Diabetes = Other Type)

|
Boxplot: 2.2.3.5.41 - Creatinine (by Data source, Age = [50 - 65), Type of Diabetes = Other Type)

|
Boxplot: 2.2.3.5.42 - Creatinine (by Data source, Age = [65 - 80), Type of Diabetes = Other Type)

|
Boxplot: 2.2.3.5.43 - Creatinine (by Data source, Age = <15, Type of Diabetes = Other Type)

|
Boxplot: 2.2.3.5.44 - Creatinine (by Data source, Age = >=80, Type of Diabetes = Other Type)

|
Trellis Boxplot: 2.2.3.5.45 - Creatinine * Gender * Age (Type of Diabetes = Type 1)

|
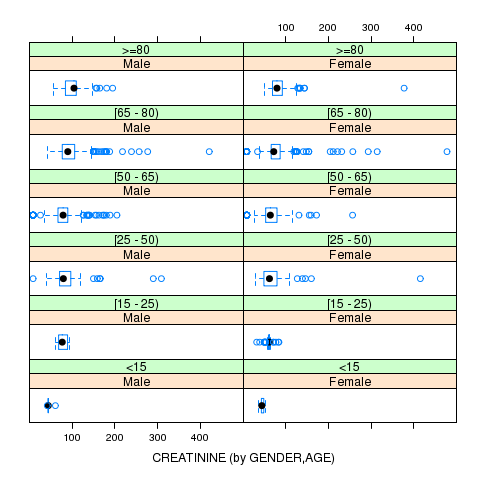
Trellis Boxplot: 2.2.3.5.46 - Creatinine * Gender * Age (Type of Diabetes = Type 2)
|
Trellis Boxplot: 2.2.3.5.47 - Creatinine * Gender * Age (Type of Diabetes = Other Type)
