| HDL |
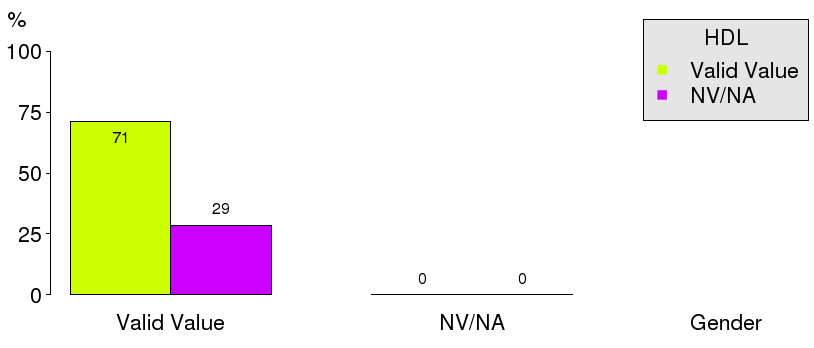
Valid Value (%) |
NV/NA (%) |
|
| Valid Value |
142083 ( 71.3) |
0 ( 0.0) |
142083 ( 71.3) |
| NV/NA |
57157 ( 28.7) |
0 ( 0.0) |
57157 ( 28.7) |
|
199240 (100.0) |
0 ( 0.0) |
199240 (100.0) |
Table 2.2.3.4.1 : HDL (by Type of Diabetes)
| CMH Chi-Square |
p.value |
df |
| 36199.6862 |
0 |
1 |

|
Barplot 2.2.3.4.1 - HDL (by Type of Diabetes)
| HDL |
Type 1 (%) |
Type 2 (%) |
Other Type (%) |
|
| <1 |
1099 ( 7.5) |
26960 ( 21.5) |
269 ( 15.4) |
28328 ( 19.9) |
| >=1 |
13551 ( 92.5) |
98726 ( 78.5) |
1478 ( 84.6) |
113755 ( 80.1) |
|
14650 ( 10.3) |
125686 ( 88.5) |
1747 ( 1.2) |
142083 (100.0) |
Table 2.2.3.4.2 : HDL (by Type of Diabetes)
| CMH Chi-Square |
p.value |
df |
| 1622.0744 |
0 |
2 |

|
Barplot 2.2.3.4.2 - HDL (by Type of Diabetes)

|
Barplot 2.2.3.4.2a - HDL (by Data Source, Type of Diabetes = Type 1)
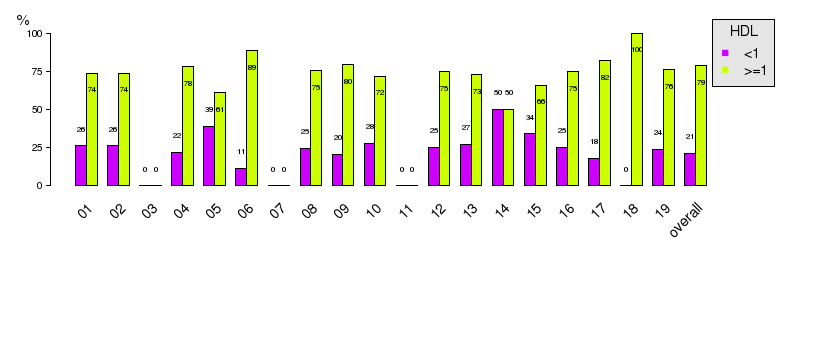
|
Barplot 2.2.3.4.2b - HDL (by Data Source, Type of Diabetes = Type 2)

|
Barplot 2.2.3.4.2c - HDL (by Data Source, Type of Diabetes = Other Type)
| HDL |
Valid Value (%) |
NV/NA (%) |
|
| Valid Value |
142083 ( 71.3) |
0 ( 0.0) |
142083 ( 71.3) |
| NV/NA |
57157 ( 28.7) |
0 ( 0.0) |
57157 ( 28.7) |
|
199240 (100.0) |
0 ( 0.0) |
199240 (100.0) |
Table 2.2.3.4.3 : HDL (by Gender)
| CMH Chi-Square |
p.value |
df |
| 36199.6862 |
0 |
1 |
|
Barplot 2.2.3.4.3 - HDL (by Gender)
| HDL |
Male (%) |
Female (%) |
|
| <1 |
18978 ( 27.5) |
9350 ( 12.8) |
28328 ( 19.9) |
| >=1 |
50072 ( 72.5) |
63683 ( 87.2) |
113755 ( 80.1) |
|
69050 ( 48.6) |
73033 ( 51.4) |
142083 (100.0) |
Table 2.2.3.4.4 : HDL (by Gender)
| CMH Chi-Square |
p.value |
df |
| 4792.0972 |
0 |
1 |

|
Barplot 2.2.3.4.4 - HDL (by Gender)
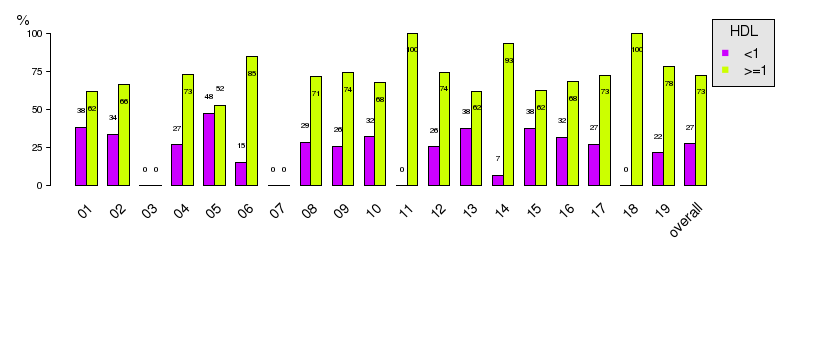
|
Barplot 2.2.3.4.4a - HDL (by Data Source, Gender = Male)

|
Barplot 2.2.3.4.4b - HDL (by Data Source, Gender = Female)
| HDL |
Valid Value (%) |
NV/NA (%) |
|
| Valid Value |
142083 ( 71.3) |
0 ( 0.0) |
142083 ( 71.3) |
| NV/NA |
57157 ( 28.7) |
0 ( 0.0) |
57157 ( 28.7) |
|
199240 (100.0) |
0 ( 0.0) |
199240 (100.0) |
Table 2.2.3.4.5 : HDL (by Age)
| CMH Chi-Square |
p.value |
df |
| 36199.6862 |
0 |
1 |

|
Barplot 2.2.3.4.5 - HDL (by Age)
| HDL |
<15 (%) |
[15 - 25) (%) |
[25 - 50) (%) |
[50 - 65) (%) |
[65 - 80) (%) |
>=80 (%) |
|
| <1 |
35 ( 6.5) |
161 ( 9.0) |
3589 ( 21.1) |
10335 ( 22.1) |
11322 ( 18.8) |
2886 ( 18.5) |
28328 ( 19.9) |
| >=1 |
505 ( 93.5) |
1637 ( 91.0) |
13400 ( 78.9) |
36468 ( 77.9) |
49022 ( 81.2) |
12723 ( 81.5) |
113755 ( 80.1) |
|
540 ( 0.4) |
1798 ( 1.3) |
16989 ( 12.0) |
46803 ( 32.9) |
60344 ( 42.5) |
15609 ( 11.0) |
142083 (100.0) |
Table 2.2.3.4.6 : HDL (by Age)
| CMH Chi-Square |
p.value |
df |
| 419.6838 |
0 |
5 |

|
Barplot 2.2.3.4.6 - HDL (by Age)

|
Barplot 2.2.3.4.6a - HDL (by Data Source, Age = <15)

|
Barplot 2.2.3.4.6b - HDL (by Data Source, Age = [15 - 25))

|
Barplot 2.2.3.4.6c - HDL (by Data Source, Age = [25 - 50))
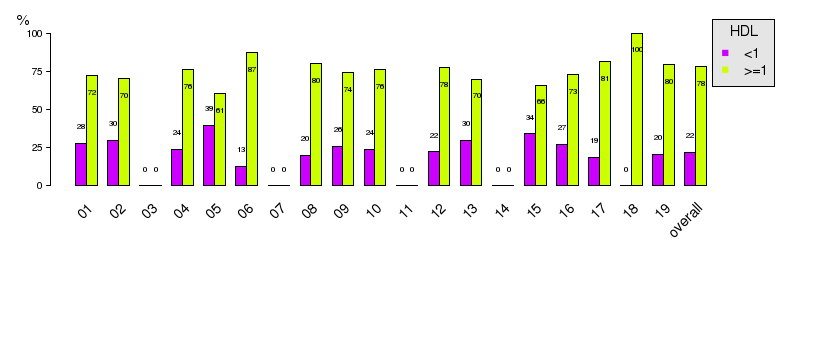
|
Barplot 2.2.3.4.6d - HDL (by Data Source, Age = [50 - 65))

|
Barplot 2.2.3.4.6e - HDL (by Data Source, Age = [65 - 80))

|
Barplot 2.2.3.4.6f - HDL (by Data Source, Age = >=80)
| HDL |
Gender |
|
| Valid Value (%) |
NV/NA (%) |
|
| Valid Value |
14650 ( 72.8) |
0 ( 0.0) |
14650 ( 72.8) |
| NV/NA |
5479 ( 27.2) |
0 ( 0.0) |
5479 ( 27.2) |
|
20129 (100.0) |
0 ( 0.0) |
20129 (100.0) |
Table 2.2.3.4.7 : HDL (by Gender, Type of Diabetes = Type 1)
| CMH Chi-Square |
p.value |
df |
| 4178.4113 |
0 |
1 |

|
Barplot 2.2.3.4.7 - HDL (by Gender, Type of Diabetes = Type 1)
| HDL |
Gender |
|
| Male (%) |
Female (%) |
|
| <1 |
863 ( 10.7) |
236 ( 3.6) |
1099 ( 7.5) |
| >=1 |
7172 ( 89.3) |
6379 ( 96.4) |
13551 ( 92.5) |
|
8035 ( 54.8) |
6615 ( 45.2) |
14650 (100.0) |
Table 2.2.3.4.8 : HDL (by Gender, Type of Diabetes = Type 1)
| CMH Chi-Square |
p.value |
df |
| 267.9777 |
0 |
1 |

|
Barplot 2.2.3.4.8 - HDL (by Gender, Type of Diabetes = Type 1)

|
Barplot 2.2.3.4.8a - HDL (by Data Source, Gender = Male, Type of Diabetes=Type 1)

|
Barplot 2.2.3.4.8b - HDL (by Data Source, Gender = Female, Type of Diabetes=Type 1)
| HDL |
Age |
|
| Valid Value (%) |
NV/NA (%) |
|
| Valid Value |
14650 ( 72.8) |
0 ( 0.0) |
14650 ( 72.8) |
| NV/NA |
5479 ( 27.2) |
0 ( 0.0) |
5479 ( 27.2) |
|
20129 (100.0) |
0 ( 0.0) |
20129 (100.0) |
Table 2.2.3.4.9 : HDL (by Age, Type of Diabetes = Type 1)
| CMH Chi-Square |
p.value |
df |
| 4178.4113 |
0 |
1 |

|
Barplot 2.2.3.4.9 - HDL (by Gender, Type of Diabetes = Type 1)
| HDL |
Age |
|
| <15 (%) |
[15 - 25) (%) |
[25 - 50) (%) |
[50 - 65) (%) |
[65 - 80) (%) |
>=80 (%) |
|
| <1 |
30 ( 5.7) |
123 ( 7.4) |
535 ( 7.4) |
268 ( 7.4) |
119 ( 8.1) |
24 ( 12.1) |
1099 ( 7.5) |
| >=1 |
495 ( 94.3) |
1546 ( 92.6) |
6649 ( 92.6) |
3343 ( 92.6) |
1343 ( 91.9) |
175 ( 87.9) |
13551 ( 92.5) |
|
525 ( 3.6) |
1669 ( 11.4) |
7184 ( 49.0) |
3611 ( 24.6) |
1462 ( 10.0) |
199 ( 1.4) |
14650 (100.0) |
Table 2.2.3.4.10 : HDL (by Age, Type of Diabetes = Type 1)
| CMH Chi-Square |
p.value |
df |
| 9.3401 |
0.0962 |
5 |

|
Barplot 2.2.3.4.10 - HDL (by Age, Type of Diabetes = Type 1)

|
Barplot 2.2.3.4.10a - HDL (by Data Source, Age = <15, Type of Diabetes=Type 1)

|
Barplot 2.2.3.4.10b - HDL (by Data Source, Age = [15 - 25), Type of Diabetes=Type 1)

|
Barplot 2.2.3.4.10c - HDL (by Data Source, Age = [25 - 50), Type of Diabetes=Type 1)

|
Barplot 2.2.3.4.10d - HDL (by Data Source, Age = [50 - 65), Type of Diabetes=Type 1)

|
Barplot 2.2.3.4.10e - HDL (by Data Source, Age = [65 - 80), Type of Diabetes=Type 1)

|
Barplot 2.2.3.4.10f - HDL (by Data Source, Age = >=80, Type of Diabetes=Type 1)
| HDL |
Gender * Age |
|
| Valid Value |
NV/NA |
|
Valid Value (%) |
NV/NA (%) |
Valid Value (%) |
NV/NA (%) |
|
| Valid Value |
14650 ( 72.8) |
0 ( 0.0) |
0 ( 0.0) |
0 ( 0.0) |
14650 ( 72.8) |
| NV/NA |
5479 ( 27.2) |
0 ( 0.0) |
0 ( 0.0) |
0 ( 0.0) |
5479 ( 27.2) |
|
20129 (100.0) |
0 ( 0.0) |
0 ( 0.0) |
0 ( 0.0) |
20129 (100.0) |
Table 2.2.3.4.11 : HDL (by Gender * Age, Type of Diabetes = Type 1)
| HDL |
Gender * Age |
|
| <15 |
[15 - 25) |
[25 - 50) |
[50 - 65) |
[65 - 80) |
>=80 |
|
Male (%) |
Female (%) |
Male (%) |
Female (%) |
Male (%) |
Female (%) |
Male (%) |
Female (%) |
Male (%) |
Female (%) |
Male (%) |
Female (%) |
|
| <1 |
16 ( 6.2) |
14 ( 5.2) |
31 ( 4.1) |
92 ( 10.0) |
92 ( 3.0) |
443 ( 10.9) |
56 ( 3.4) |
212 ( 10.7) |
35 ( 4.5) |
84 ( 12.1) |
6 ( 5.6) |
18 ( 19.8) |
1099 ( 7.5) |
| >=1 |
241 ( 93.8) |
254 ( 94.8) |
718 ( 95.9) |
828 ( 90.0) |
3013 ( 97.0) |
3636 ( 89.1) |
1570 ( 96.6) |
1773 ( 89.3) |
735 ( 95.5) |
608 ( 87.9) |
102 ( 94.4) |
73 ( 80.2) |
13551 ( 92.5) |
|
257 ( 1.8) |
268 ( 1.8) |
749 ( 5.1) |
920 ( 6.3) |
3105 ( 21.2) |
4079 ( 27.8) |
1626 ( 11.1) |
1985 ( 13.5) |
770 ( 5.3) |
692 ( 4.7) |
108 ( 0.7) |
91 ( 0.6) |
14650 (100.0) |
Table 2.2.3.4.12 : HDL (by Gender * Age, Type of Diabetes = Type 1)
| CMH Chi-Square |
p.value |
df |
| 35197.479 |
0 |
23 |
| HDL |
Gender |
|
| Valid Value (%) |
NV/NA (%) |
|
| Valid Value |
125686 ( 71.7) |
0 ( 0.0) |
125686 ( 71.7) |
| NV/NA |
49555 ( 28.3) |
0 ( 0.0) |
49555 ( 28.3) |
|
175241 (100.0) |
0 ( 0.0) |
175241 (100.0) |
Table 2.2.3.4.13 : HDL (by Gender, Type of Diabetes = Type 2)
| CMH Chi-Square |
p.value |
df |
| 33074.0475 |
0 |
1 |

|
Barplot 2.2.3.4.11 - HDL (by Gender, Type of Diabetes = Type 2)
| HDL |
Gender |
|
| Male (%) |
Female (%) |
|
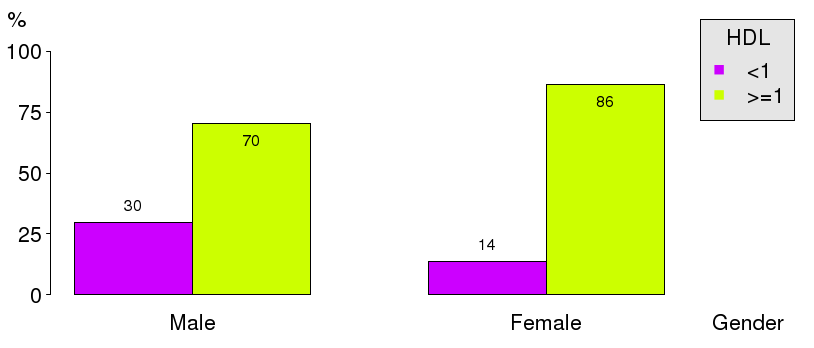
| <1 |
17917 ( 29.8) |
9043 ( 13.8) |
26960 ( 21.5) |
| >=1 |
42306 ( 70.2) |
56420 ( 86.2) |
98726 ( 78.5) |
|
60223 ( 47.9) |
65463 ( 52.1) |
125686 (100.0) |
Table 2.2.3.4.14 : HDL (by Gender, Type of Diabetes = Type 2)
| CMH Chi-Square |
p.value |
df |
| 4727.4825 |
0 |
1 |
|
Barplot 2.2.3.4.12 - HDL (by Gender, Type of Diabetes = Type 2)

|
Barplot 2.2.3.4.12a - HDL (by Data Source, Gender = Male, Type of Diabetes=Type 2)

|
Barplot 2.2.3.4.12b - HDL (by Data Source, Gender = Female, Type of Diabetes=Type 2)
| HDL |
Age |
|
| Valid Value (%) |
NV/NA (%) |
|
| Valid Value |
125686 ( 71.7) |
0 ( 0.0) |
125686 ( 71.7) |
| NV/NA |
49555 ( 28.3) |
0 ( 0.0) |
49555 ( 28.3) |
|
175241 (100.0) |
0 ( 0.0) |
175241 (100.0) |
Table 2.2.3.4.15 : HDL (by Age, Type of Diabetes = Type 2)
| CMH Chi-Square |
p.value |
df |
| 33074.0475 |
0 |
1 |

|
Barplot 2.2.3.4.13 - HDL (by Gender, Type of Diabetes = Type 2)
| HDL |
Age |
|
| <15 (%) |
[15 - 25) (%) |
[25 - 50) (%) |
[50 - 65) (%) |
[65 - 80) (%) |
>=80 (%) |
|
| <1 |
3 ( 37.5) |
35 ( 40.7) |
2981 ( 32.3) |
9956 ( 23.4) |
11129 ( 19.1) |
2856 ( 18.6) |
26960 ( 21.5) |
| >=1 |
5 ( 62.5) |
51 ( 59.3) |
6236 ( 67.7) |
32673 ( 76.6) |
47280 ( 80.9) |
12481 ( 81.4) |
98726 ( 78.5) |
|
8 ( 0.0) |
86 ( 0.1) |
9217 ( 7.3) |
42629 ( 33.9) |
58409 ( 46.5) |
15337 ( 12.2) |
125686 (100.0) |
Table 2.2.3.4.16 : HDL (by Age, Type of Diabetes = Type 2)
| CMH Chi-Square |
p.value |
df |
| 1032.8694 |
0 |
5 |

|
Barplot 2.2.3.4.14 - HDL (by Age, Type of Diabetes = Type 2)

|
Barplot 2.2.3.4.14a - HDL (by Data Source, Age = <15, Type of Diabetes=Type 2)

|
Barplot 2.2.3.4.14b - HDL (by Data Source, Age = [15 - 25), Type of Diabetes=Type 2)

|
Barplot 2.2.3.4.14c - HDL (by Data Source, Age = [25 - 50), Type of Diabetes=Type 2)

|
Barplot 2.2.3.4.14d - HDL (by Data Source, Age = [50 - 65), Type of Diabetes=Type 2)

|
Barplot 2.2.3.4.14e - HDL (by Data Source, Age = [65 - 80), Type of Diabetes=Type 2)

|
Barplot 2.2.3.4.14f - HDL (by Data Source, Age = >=80, Type of Diabetes=Type 2)
| HDL |
Gender * Age |
|
| Valid Value |
NV/NA |
|
Valid Value (%) |
NV/NA (%) |
Valid Value (%) |
NV/NA (%) |
|
| Valid Value |
125686 ( 71.7) |
0 ( 0.0) |
0 ( 0.0) |
0 ( 0.0) |
125686 ( 71.7) |
| NV/NA |
49555 ( 28.3) |
0 ( 0.0) |
0 ( 0.0) |
0 ( 0.0) |
49555 ( 28.3) |
|
175241 (100.0) |
0 ( 0.0) |
0 ( 0.0) |
0 ( 0.0) |
175241 (100.0) |
Table 2.2.3.4.17 : HDL (by Gender * Age, Type of Diabetes = Type 2)
| HDL |
Gender * Age |
|
| <15 |
[15 - 25) |
[25 - 50) |
[50 - 65) |
[65 - 80) |
>=80 |
|
Male (%) |
Female (%) |
Male (%) |
Female (%) |
Male (%) |
Female (%) |
Male (%) |
Female (%) |
Male (%) |
Female (%) |
Male (%) |
Female (%) |
|
| <1 |
1 ( 25.0) |
2 ( 50.0) |
18 ( 38.3) |
17 ( 43.6) |
787 ( 20.9) |
2194 ( 40.3) |
2813 ( 14.2) |
7143 ( 31.4) |
4000 ( 12.5) |
7129 ( 27.0) |
1424 ( 14.6) |
1432 ( 25.6) |
26960 ( 21.5) |
| >=1 |
3 ( 75.0) |
2 ( 50.0) |
29 ( 61.7) |
22 ( 56.4) |
2985 ( 79.1) |
3251 ( 59.7) |
17045 ( 85.8) |
15628 ( 68.6) |
28031 ( 87.5) |
19249 ( 73.0) |
8327 ( 85.4) |
4154 ( 74.4) |
98726 ( 78.5) |
|
4 ( 0.0) |
4 ( 0.0) |
47 ( 0.0) |
39 ( 0.0) |
3772 ( 3.0) |
5445 ( 4.3) |
19858 ( 15.8) |
22771 ( 18.1) |
32031 ( 25.5) |
26378 ( 21.0) |
9751 ( 7.8) |
5586 ( 4.4) |
125686 (100.0) |
Table 2.2.3.4.18 : HDL (by Gender * Age, Type of Diabetes = Type 2)
| CMH Chi-Square |
p.value |
df |
| 243304.5311 |
0 |
23 |
| HDL |
Gender |
|
| Valid Value (%) |
NV/NA (%) |
|
| Valid Value |
1747 ( 45.1) |
0 ( 0.0) |
1747 ( 45.1) |
| NV/NA |
2123 ( 54.9) |
0 ( 0.0) |
2123 ( 54.9) |
|
3870 (100.0) |
0 ( 0.0) |
3870 (100.0) |
Table 2.2.3.4.19 : HDL (by Gender, Type of Diabetes = Other Type)
| CMH Chi-Square |
p.value |
df |
| 36.5313 |
0 |
1 |

|
Barplot 2.2.3.4.15 - HDL (by Gender, Type of Diabetes = Other Type)
| HDL |
Gender |
|
| Male (%) |
Female (%) |
|
| <1 |
198 ( 25.0) |
71 ( 7.4) |
269 ( 15.4) |
| >=1 |
594 ( 75.0) |
884 ( 92.6) |
1478 ( 84.6) |
|
792 ( 45.3) |
955 ( 54.7) |
1747 (100.0) |
Table 2.2.3.4.20 : HDL (by Gender, Type of Diabetes = Other Type)
| CMH Chi-Square |
p.value |
df |
| 101.2007 |
0 |
1 |

|
Barplot 2.2.3.4.16 - HDL (by Gender, Type of Diabetes = Other Type)

|
Barplot 2.2.3.4.16a - HDL (by Data Source, Gender = Male, Type of Diabetes=Other Type)

|
Barplot 2.2.3.4.16b - HDL (by Data Source, Gender = Female, Type of Diabetes=Other Type)
| HDL |
Age |
|
| Valid Value (%) |
NV/NA (%) |
|
| Valid Value |
1747 ( 45.1) |
0 ( 0.0) |
1747 ( 45.1) |
| NV/NA |
2123 ( 54.9) |
0 ( 0.0) |
2123 ( 54.9) |
|
3870 (100.0) |
0 ( 0.0) |
3870 (100.0) |
Table 2.2.3.4.21 : HDL (by Age, Type of Diabetes = Other Type)
| CMH Chi-Square |
p.value |
df |
| 36.5313 |
0 |
1 |

|
Barplot 2.2.3.4.17 - HDL (by Gender, Type of Diabetes = Other Type)
| HDL |
Age |
|
| <15 (%) |
[15 - 25) (%) |
[25 - 50) (%) |
[50 - 65) (%) |
[65 - 80) (%) |
>=80 (%) |
|
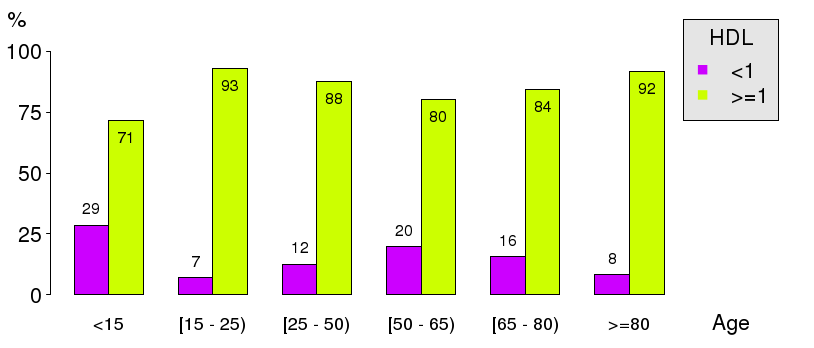
| <1 |
2 ( 28.6) |
3 ( 7.0) |
73 ( 12.4) |
111 ( 19.7) |
74 ( 15.6) |
6 ( 8.2) |
269 ( 15.4) |
| >=1 |
5 ( 71.4) |
40 ( 93.0) |
515 ( 87.6) |
452 ( 80.3) |
399 ( 84.4) |
67 ( 91.8) |
1478 ( 84.6) |
|
7 ( 0.4) |
43 ( 2.5) |
588 ( 33.7) |
563 ( 32.2) |
473 ( 27.1) |
73 ( 4.2) |
1747 (100.0) |
Table 2.2.3.4.22 : HDL (by Age, Type of Diabetes = Other Type)
| CMH Chi-Square |
p.value |
df |
| 18.2574 |
0.0026 |
5 |
|
Barplot 2.2.3.4.18 - HDL (by Age, Type of Diabetes = Other Type)

|
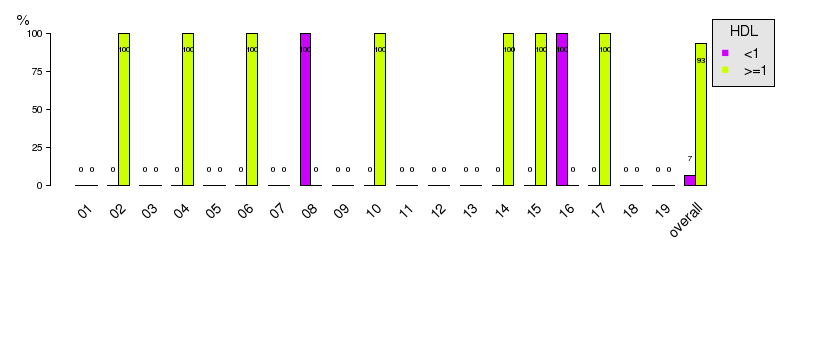
Barplot 2.2.3.4.18a - HDL (by Data Source, Age = <15, Type of Diabetes=Other Type)
|
Barplot 2.2.3.4.18b - HDL (by Data Source, Age = [15 - 25), Type of Diabetes=Other Type)

|
Barplot 2.2.3.4.18c - HDL (by Data Source, Age = [25 - 50), Type of Diabetes=Other Type)

|
Barplot 2.2.3.4.18d - HDL (by Data Source, Age = [50 - 65), Type of Diabetes=Other Type)
|
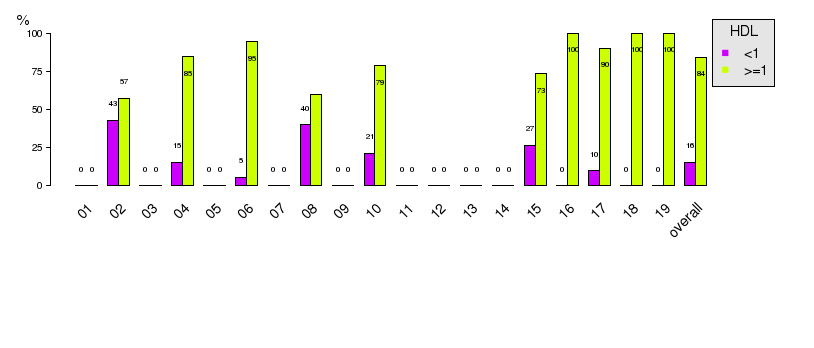
Barplot 2.2.3.4.18e - HDL (by Data Source, Age = [65 - 80), Type of Diabetes=Other Type)

|
Barplot 2.2.3.4.18f - HDL (by Data Source, Age = >=80, Type of Diabetes=Other Type)
| HDL |
Gender * Age |
|
| Valid Value |
NV/NA |
|
Valid Value (%) |
NV/NA (%) |
Valid Value (%) |
NV/NA (%) |
|
| Valid Value |
1747 ( 45.1) |
0 ( 0.0) |
0 ( 0.0) |
0 ( 0.0) |
1747 ( 45.1) |
| NV/NA |
2123 ( 54.9) |
0 ( 0.0) |
0 ( 0.0) |
0 ( 0.0) |
2123 ( 54.9) |
|
3870 (100.0) |
0 ( 0.0) |
0 ( 0.0) |
0 ( 0.0) |
3870 (100.0) |
Table 2.2.3.4.23 : HDL (by Gender * Age, Type of Diabetes = Other Type)
| HDL |
Gender * Age |
|
| <15 |
[15 - 25) |
[25 - 50) |
[50 - 65) |
[65 - 80) |
>=80 |
|
Male (%) |
Female (%) |
Male (%) |
Female (%) |
Male (%) |
Female (%) |
Male (%) |
Female (%) |
Male (%) |
Female (%) |
Male (%) |
Female (%) |
|
| <1 |
2 ( 50.0) |
0 ( 0.0) |
2 ( 5.4) |
1 ( 16.7) |
15 ( 3.7) |
58 ( 32.0) |
27 ( 11.9) |
84 ( 25.0) |
20 ( 8.6) |
54 ( 22.5) |
5 ( 10.6) |
1 ( 3.8) |
269 ( 15.4) |
| >=1 |
2 ( 50.0) |
3 (100.0) |
35 ( 94.6) |
5 ( 83.3) |
392 ( 96.3) |
123 ( 68.0) |
200 ( 88.1) |
252 ( 75.0) |
213 ( 91.4) |
186 ( 77.5) |
42 ( 89.4) |
25 ( 96.2) |
1478 ( 84.6) |
|
4 ( 0.2) |
3 ( 0.2) |
37 ( 2.1) |
6 ( 0.3) |
407 ( 23.3) |
181 ( 10.4) |
227 ( 13.0) |
336 ( 19.2) |
233 ( 13.3) |
240 ( 13.7) |
47 ( 2.7) |
26 ( 1.5) |
1747 (100.0) |
Table 2.2.3.4.24 : HDL (by Gender * Age, Type of Diabetes = Other Type)
| CMH Chi-Square |
p.value |
df |
| 3344.7779 |
0 |
23 |

|
Trellis Barplot: 2.2.3.4.254 - HDL * Gender * Age (Type of Diabetes = Type 1)
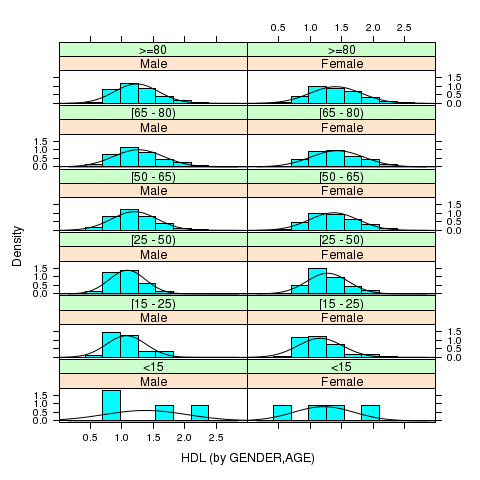
|
Trellis Barplot: 2.2.3.4.255 - HDL * Gender * Age (Type of Diabetes = Type 2)

|
Trellis Barplot: 2.2.3.4.256 - HDL * Gender * Age (Type of Diabetes = Other Type)
