| DBP |
Valid Value (%) |
NV/NA (%) |
|
| Valid Value |
169910 ( 85.2) |
0 ( 0.0) |
169910 ( 85.2) |
| NV/NA |
29609 ( 14.8) |
0 ( 0.0) |
29609 ( 14.8) |
|
199519 (100.0) |
0 ( 0.0) |
199519 (100.0) |
Table 2.2.3.2.1 : DBP (by Type of Diabetes)
| CMH Chi-Square |
p.value |
df |
| 98659.1282 |
0 |
1 |
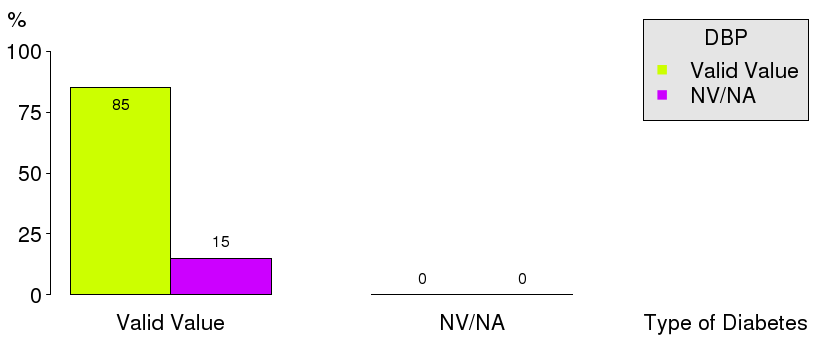
|
Barplot 2.2.3.2.1 - DBP (by Type of Diabetes)
| DBP |
Type 1 (%) |
Type 2 (%) |
Other Type (%) |
|
| <80 |
9036 ( 53.4) |
51216 ( 34.1) |
1424 ( 51.7) |
61676 ( 36.3) |
| >=80 |
7870 ( 46.6) |
99035 ( 65.9) |
1329 ( 48.3) |
108234 ( 63.7) |
|
16906 ( 9.9) |
150251 ( 88.4) |
2753 ( 1.6) |
169910 (100.0) |
Table 2.2.3.2.2 : DBP (by Type of Diabetes)
| CMH Chi-Square |
p.value |
df |
| 2751.59 |
0 |
2 |
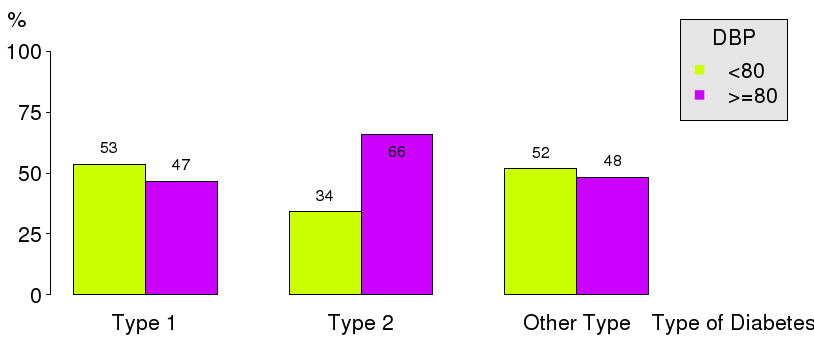
|
Barplot 2.2.3.2.2 - DBP (by Type of Diabetes)
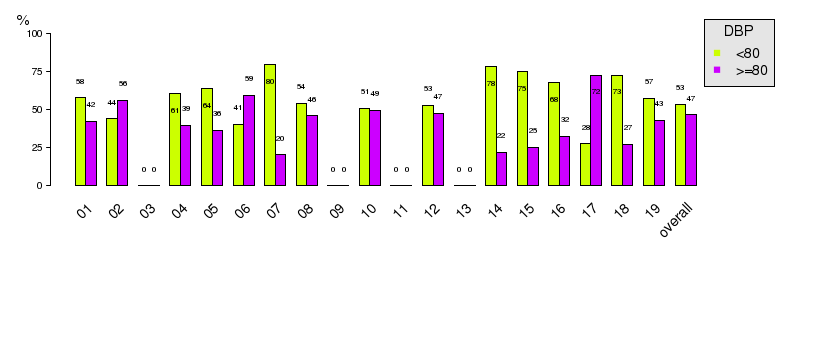
|
Barplot 2.2.3.2.2a - DBP (by Data Source, Type of Diabetes = Type 1)
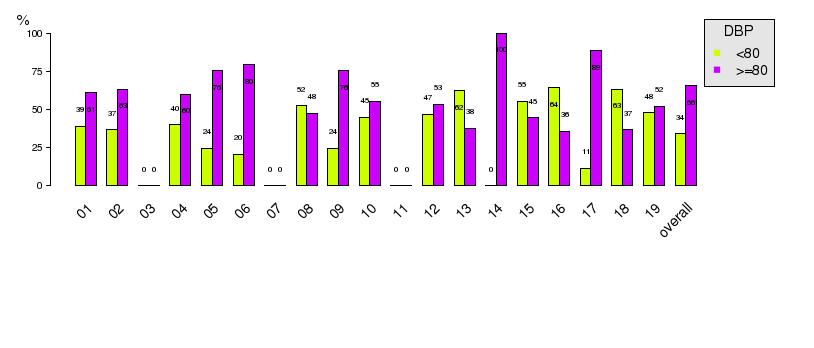
|
Barplot 2.2.3.2.2b - DBP (by Data Source, Type of Diabetes = Type 2)
|
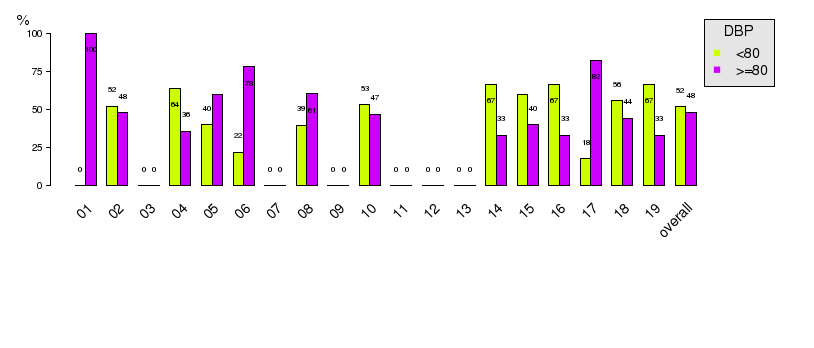
Barplot 2.2.3.2.2c - DBP (by Data Source, Type of Diabetes = Other Type)
| DBP |
Valid Value (%) |
NV/NA (%) |
|
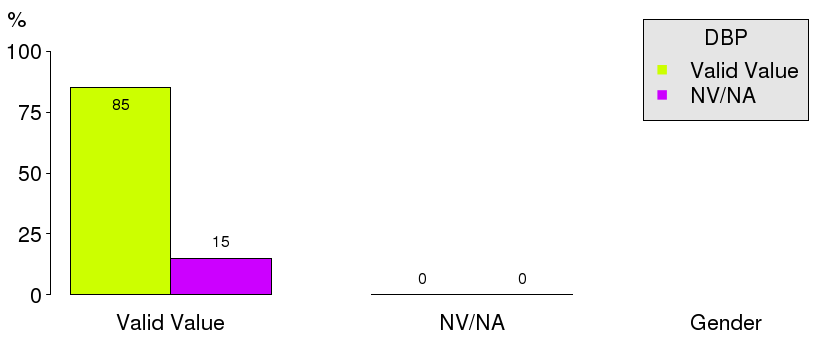
| Valid Value |
169910 ( 85.2) |
0 ( 0.0) |
169910 ( 85.2) |
| NV/NA |
29609 ( 14.8) |
0 ( 0.0) |
29609 ( 14.8) |
|
199519 (100.0) |
0 ( 0.0) |
199519 (100.0) |
Table 2.2.3.2.3 : DBP (by Gender)
| CMH Chi-Square |
p.value |
df |
| 98659.1282 |
0 |
1 |
|
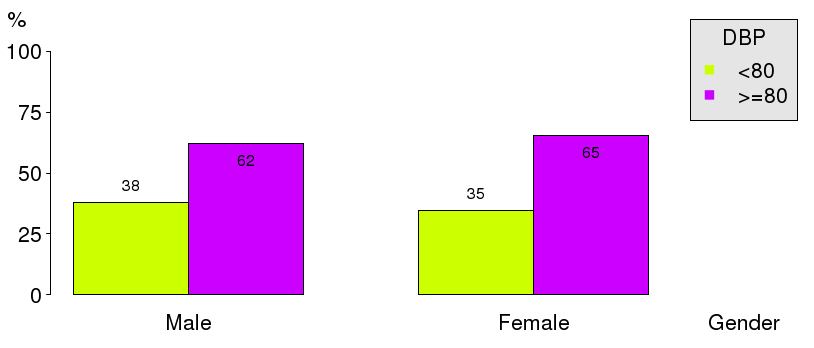
Barplot 2.2.3.2.3 - DBP (by Gender)
| DBP |
Male (%) |
Female (%) |
|
| <80 |
30767 ( 38.0) |
30909 ( 34.7) |
61676 ( 36.3) |
| >=80 |
50194 ( 62.0) |
58040 ( 65.3) |
108234 ( 63.7) |
|
80961 ( 47.6) |
88949 ( 52.4) |
169910 (100.0) |
Table 2.2.3.2.4 : DBP (by Gender)
| CMH Chi-Square |
p.value |
df |
| 193.8392 |
0 |
1 |
|
Barplot 2.2.3.2.4 - DBP (by Gender)
|
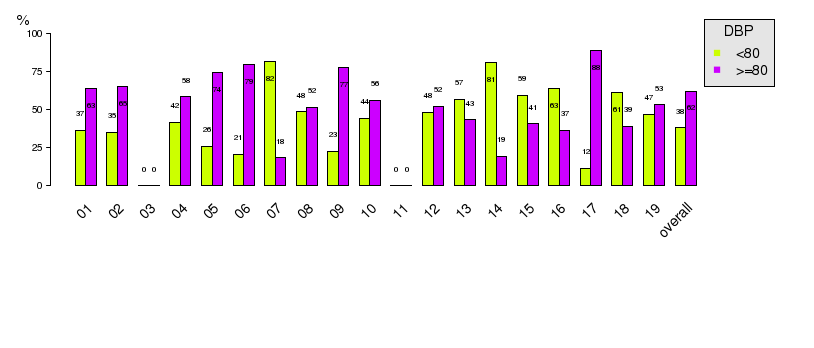
Barplot 2.2.3.2.4a - DBP (by Data Source, Gender = Male)
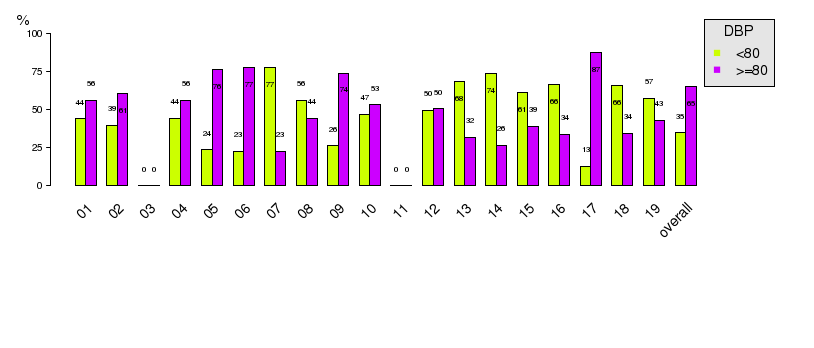
|
Barplot 2.2.3.2.4b - DBP (by Data Source, Gender = Female)
| DBP |
Valid Value (%) |
NV/NA (%) |
|
| Valid Value |
169910 ( 85.2) |
0 ( 0.0) |
169910 ( 85.2) |
| NV/NA |
29609 ( 14.8) |
0 ( 0.0) |
29609 ( 14.8) |
|
199519 (100.0) |
0 ( 0.0) |
199519 (100.0) |
Table 2.2.3.2.5 : DBP (by Age)
| CMH Chi-Square |
p.value |
df |
| 98659.1282 |
0 |
1 |
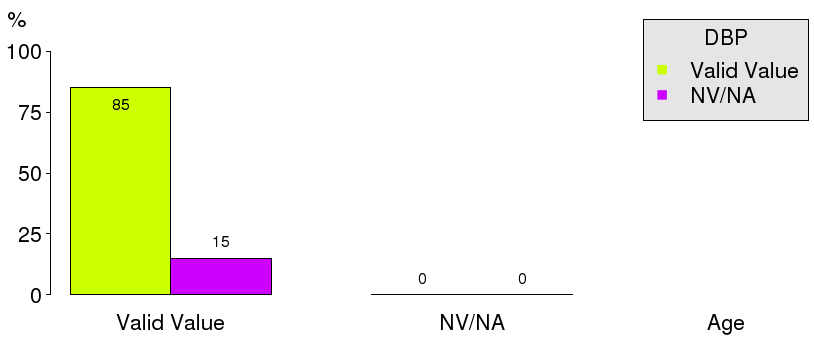
|
Barplot 2.2.3.2.5 - DBP (by Age)
| DBP |
<15 (%) |
[15 - 25) (%) |
[25 - 50) (%) |
[50 - 65) (%) |
[65 - 80) (%) |
>=80 (%) |
|
| <80 |
626 ( 92.2) |
1672 ( 67.3) |
7616 ( 38.2) |
16012 ( 29.2) |
26709 ( 36.9) |
9041 ( 46.4) |
61676 ( 36.3) |
| >=80 |
53 ( 7.8) |
811 ( 32.7) |
12345 ( 61.8) |
38917 ( 70.8) |
45663 ( 63.1) |
10445 ( 53.6) |
108234 ( 63.7) |
|
679 ( 0.4) |
2483 ( 1.5) |
19961 ( 11.7) |
54929 ( 32.3) |
72372 ( 42.6) |
19486 ( 11.5) |
169910 (100.0) |
Table 2.2.3.2.6 : DBP (by Age)
| CMH Chi-Square |
p.value |
df |
| 4066.5527 |
0 |
5 |
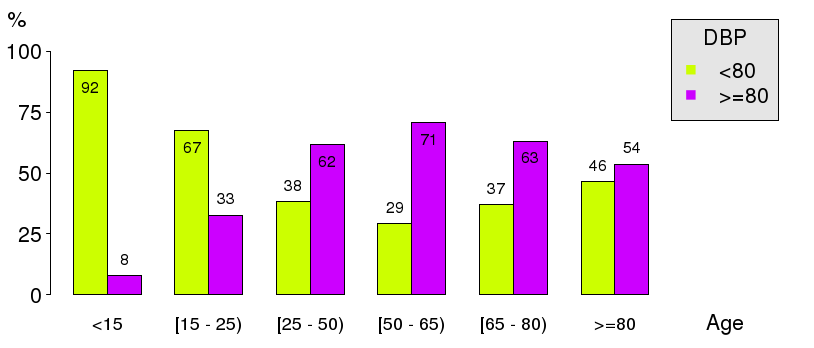
|
Barplot 2.2.3.2.6 - DBP (by Age)
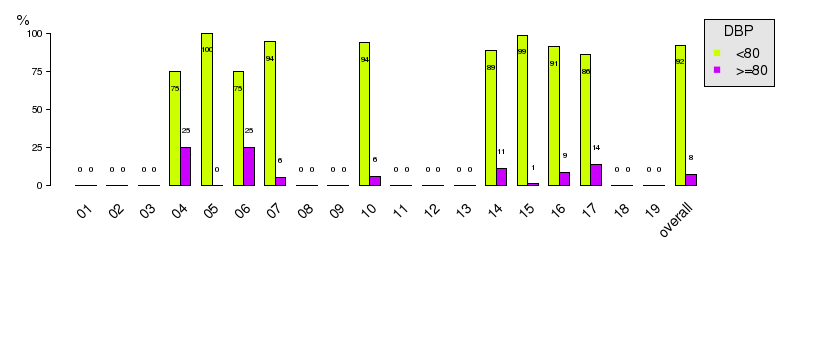
|
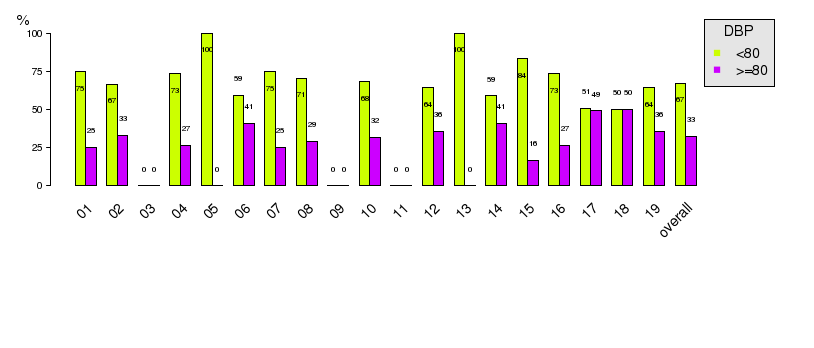
Barplot 2.2.3.2.6a - DBP (by Data Source, Age = <15)
|
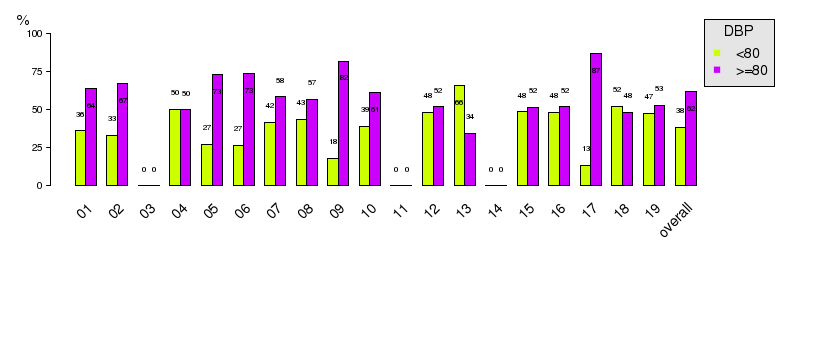
Barplot 2.2.3.2.6b - DBP (by Data Source, Age = [15 - 25))
|
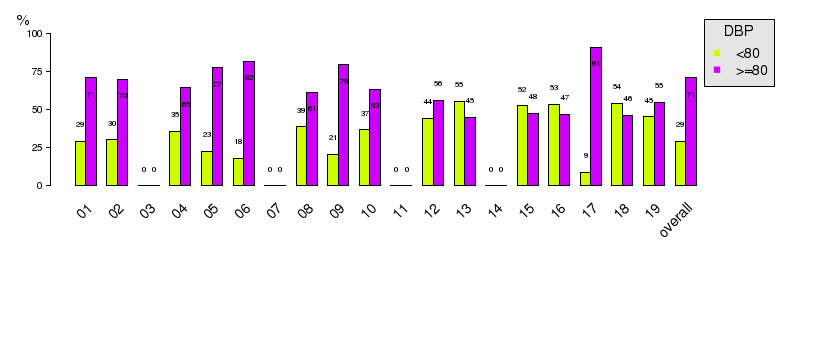
Barplot 2.2.3.2.6c - DBP (by Data Source, Age = [25 - 50))
|
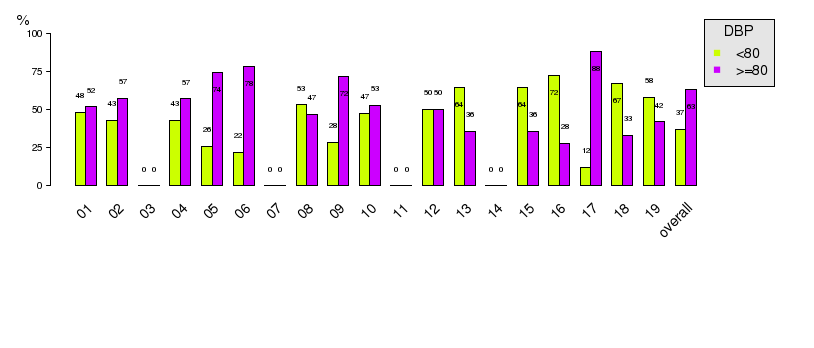
Barplot 2.2.3.2.6d - DBP (by Data Source, Age = [50 - 65))
|
Barplot 2.2.3.2.6e - DBP (by Data Source, Age = [65 - 80))
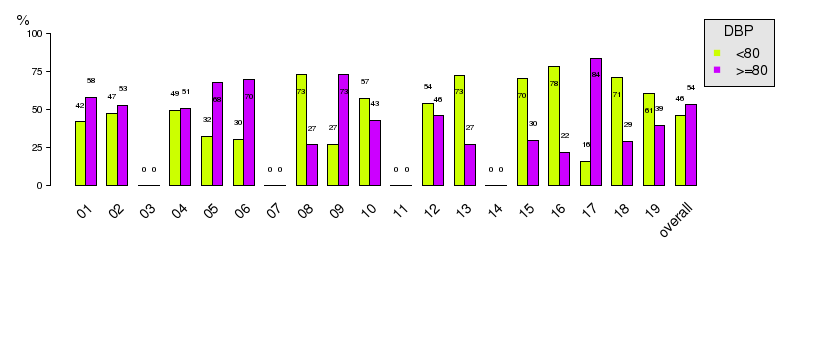
|
Barplot 2.2.3.2.6f - DBP (by Data Source, Age = >=80)
| DBP |
Gender |
|
| Valid Value (%) |
NV/NA (%) |
|
| Valid Value |
16906 ( 82.8) |
0 ( 0.0) |
16906 ( 82.8) |
| NV/NA |
3503 ( 17.2) |
0 ( 0.0) |
3503 ( 17.2) |
|
20409 (100.0) |
0 ( 0.0) |
20409 (100.0) |
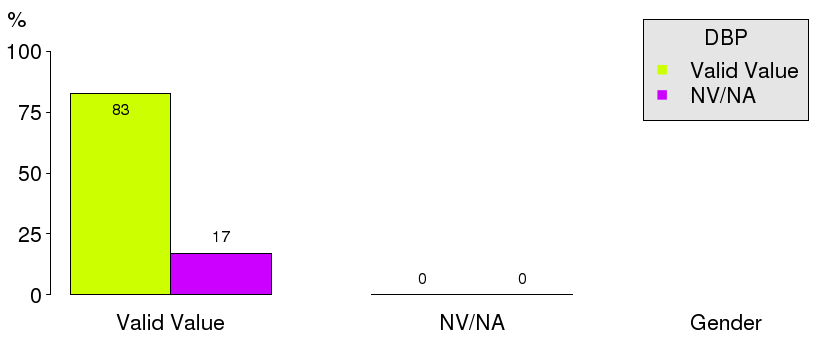
Table 2.2.3.2.7 : DBP (by Gender, Type of Diabetes = Type 1)
| CMH Chi-Square |
p.value |
df |
| 8802.0192 |
0 |
1 |
|
Barplot 2.2.3.2.7 - DBP (by Gender, Type of Diabetes = Type 1)
| DBP |
Gender |
|
| Male (%) |
Female (%) |
|
| <80 |
4615 ( 50.2) |
4421 ( 57.3) |
9036 ( 53.4) |
| >=80 |
4572 ( 49.8) |
3298 ( 42.7) |
7870 ( 46.6) |
|
9187 ( 54.3) |
7719 ( 45.7) |
16906 (100.0) |
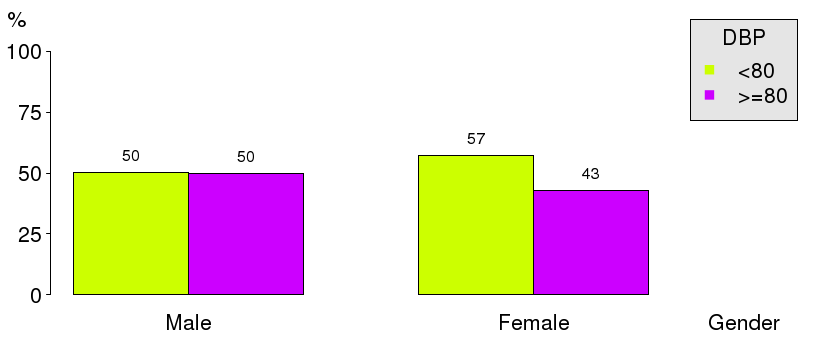
Table 2.2.3.2.8 : DBP (by Gender, Type of Diabetes = Type 1)
| CMH Chi-Square |
p.value |
df |
| 83.2773 |
0 |
1 |
|
Barplot 2.2.3.2.8 - DBP (by Gender, Type of Diabetes = Type 1)
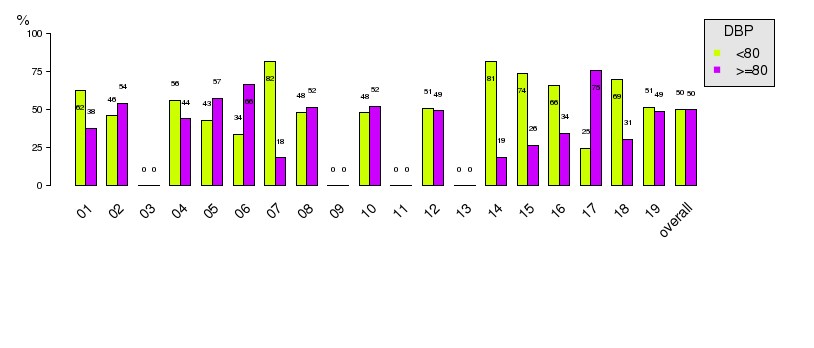
|
Barplot 2.2.3.2.8a - DBP (by Data Source, Gender = Male, Type of Diabetes=Type 1)
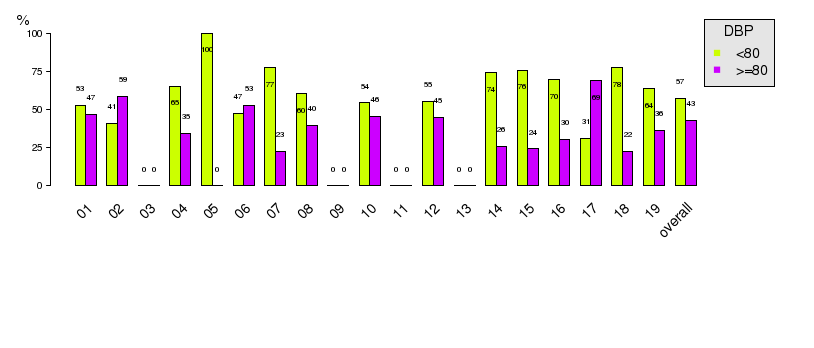
|
Barplot 2.2.3.2.8b - DBP (by Data Source, Gender = Female, Type of Diabetes=Type 1)
| DBP |
Age |
|
| Valid Value (%) |
NV/NA (%) |
|
| Valid Value |
16906 ( 82.8) |
0 ( 0.0) |
16906 ( 82.8) |
| NV/NA |
3503 ( 17.2) |
0 ( 0.0) |
3503 ( 17.2) |
|
20409 (100.0) |
0 ( 0.0) |
20409 (100.0) |
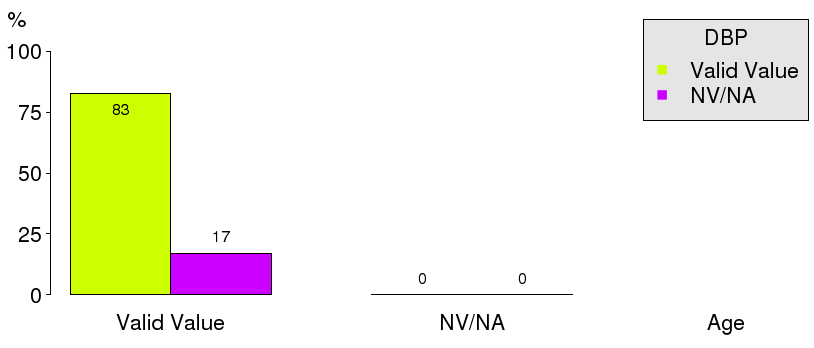
Table 2.2.3.2.9 : DBP (by Age, Type of Diabetes = Type 1)
| CMH Chi-Square |
p.value |
df |
| 8802.0192 |
0 |
1 |
|
Barplot 2.2.3.2.9 - DBP (by Gender, Type of Diabetes = Type 1)
| DBP |
Age |
|
| <15 (%) |
[15 - 25) (%) |
[25 - 50) (%) |
[50 - 65) (%) |
[65 - 80) (%) |
>=80 (%) |
|
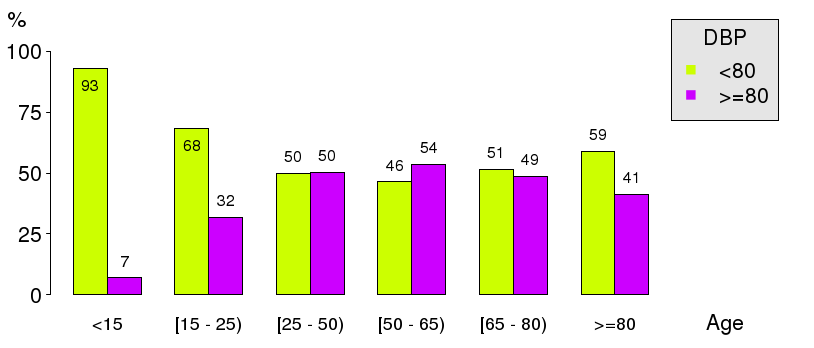
| <80 |
615 ( 93.0) |
1577 ( 68.3) |
3986 ( 49.7) |
1868 ( 46.4) |
850 ( 51.4) |
140 ( 58.8) |
9036 ( 53.4) |
| >=80 |
46 ( 7.0) |
733 ( 31.7) |
4033 ( 50.3) |
2156 ( 53.6) |
804 ( 48.6) |
98 ( 41.2) |
7870 ( 46.6) |
|
661 ( 3.9) |
2310 ( 13.7) |
8019 ( 47.4) |
4024 ( 23.8) |
1654 ( 9.8) |
238 ( 1.4) |
16906 (100.0) |
Table 2.2.3.2.10 : DBP (by Age, Type of Diabetes = Type 1)
| CMH Chi-Square |
p.value |
df |
| 750.9077 |
0 |
5 |
|
Barplot 2.2.3.2.10 - DBP (by Age, Type of Diabetes = Type 1)
|
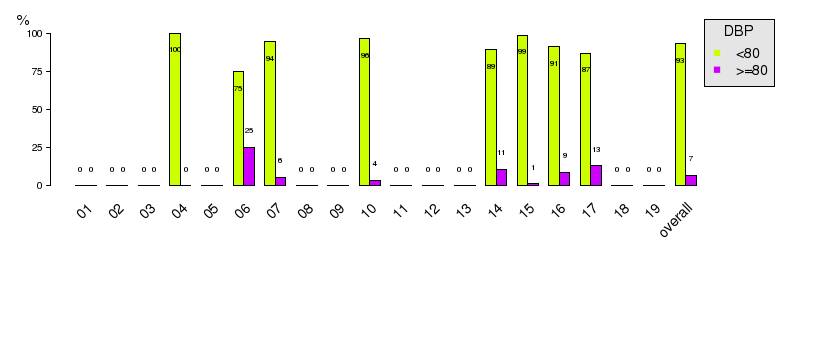
Barplot 2.2.3.2.10a - DBP (by Data Source, Age = <15, Type of Diabetes=Type 1)

|
Barplot 2.2.3.2.10b - DBP (by Data Source, Age = [15 - 25), Type of Diabetes=Type 1)
|
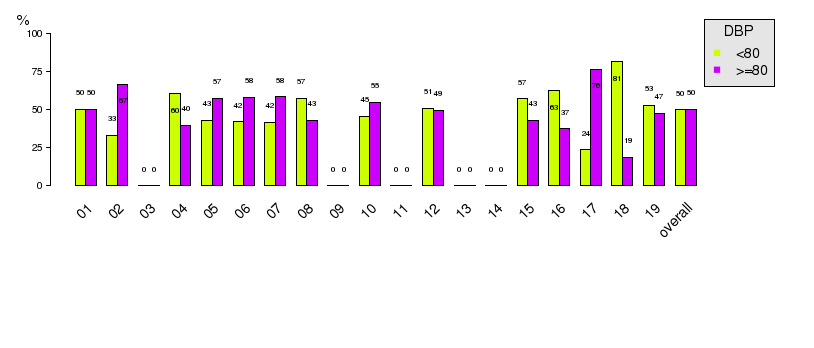
Barplot 2.2.3.2.10c - DBP (by Data Source, Age = [25 - 50), Type of Diabetes=Type 1)
|
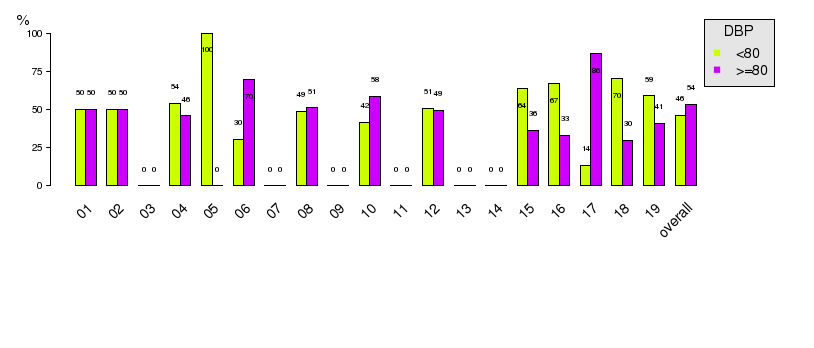
Barplot 2.2.3.2.10d - DBP (by Data Source, Age = [50 - 65), Type of Diabetes=Type 1)
|
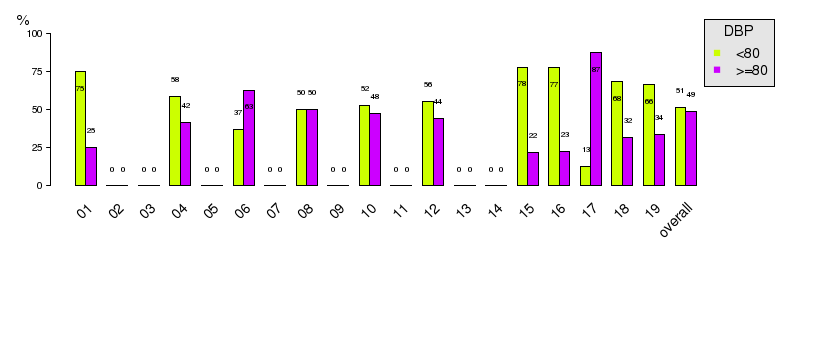
Barplot 2.2.3.2.10e - DBP (by Data Source, Age = [65 - 80), Type of Diabetes=Type 1)
|
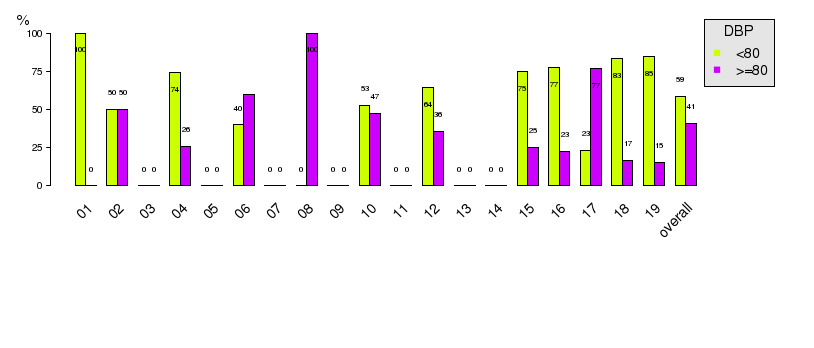
Barplot 2.2.3.2.10f - DBP (by Data Source, Age = >=80, Type of Diabetes=Type 1)
| DBP |
Gender * Age |
|
| Valid Value |
NV/NA |
|
Valid Value (%) |
NV/NA (%) |
Valid Value (%) |
NV/NA (%) |
|
| Valid Value |
16906 ( 82.8) |
0 ( 0.0) |
0 ( 0.0) |
0 ( 0.0) |
16906 ( 82.8) |
| NV/NA |
3503 ( 17.2) |
0 ( 0.0) |
0 ( 0.0) |
0 ( 0.0) |
3503 ( 17.2) |
|
20409 (100.0) |
0 ( 0.0) |
0 ( 0.0) |
0 ( 0.0) |
20409 (100.0) |
Table 2.2.3.2.11 : DBP (by Gender * Age, Type of Diabetes = Type 1)
| DBP |
Gender * Age |
|
| <15 |
[15 - 25) |
[25 - 50) |
[50 - 65) |
[65 - 80) |
>=80 |
|
Male (%) |
Female (%) |
Male (%) |
Female (%) |
Male (%) |
Female (%) |
Male (%) |
Female (%) |
Male (%) |
Female (%) |
Male (%) |
Female (%) |
|
| <80 |
292 ( 92.7) |
323 ( 93.4) |
735 ( 69.9) |
842 ( 66.9) |
1982 ( 56.1) |
2004 ( 44.7) |
915 ( 50.4) |
953 ( 43.1) |
419 ( 48.4) |
431 ( 54.7) |
78 ( 56.5) |
62 ( 62.0) |
9036 ( 53.4) |
| >=80 |
23 ( 7.3) |
23 ( 6.6) |
317 ( 30.1) |
416 ( 33.1) |
1551 ( 43.9) |
2482 ( 55.3) |
900 ( 49.6) |
1256 ( 56.9) |
447 ( 51.6) |
357 ( 45.3) |
60 ( 43.5) |
38 ( 38.0) |
7870 ( 46.6) |
|
315 ( 1.9) |
346 ( 2.0) |
1052 ( 6.2) |
1258 ( 7.4) |
3533 ( 20.9) |
4486 ( 26.5) |
1815 ( 10.7) |
2209 ( 13.1) |
866 ( 5.1) |
788 ( 4.7) |
138 ( 0.8) |
100 ( 0.6) |
16906 (100.0) |
Table 2.2.3.2.12 : DBP (by Gender * Age, Type of Diabetes = Type 1)
| CMH Chi-Square |
p.value |
df |
| 15830.5508 |
0 |
23 |
| DBP |
Gender |
|
| Valid Value (%) |
NV/NA (%) |
|
| Valid Value |
150251 ( 85.7) |
0 ( 0.0) |
150251 ( 85.7) |
| NV/NA |
24989 ( 14.3) |
0 ( 0.0) |
24989 ( 14.3) |
|
175240 (100.0) |
0 ( 0.0) |
175240 (100.0) |
Table 2.2.3.2.13 : DBP (by Gender, Type of Diabetes = Type 2)
| CMH Chi-Square |
p.value |
df |
| 89537.5978 |
0 |
1 |

|
Barplot 2.2.3.2.11 - DBP (by Gender, Type of Diabetes = Type 2)
| DBP |
Gender |
|
| Male (%) |
Female (%) |
|
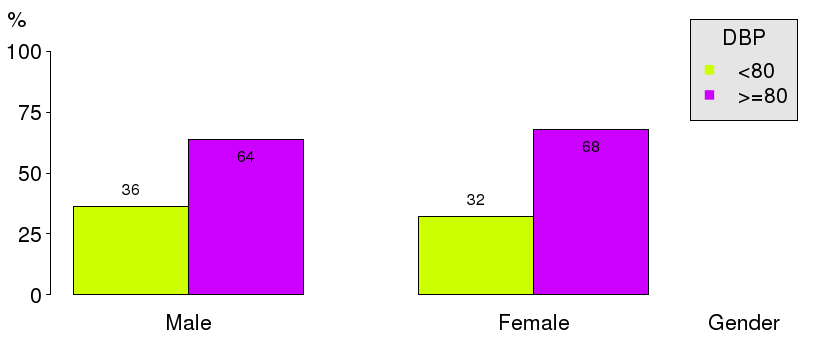
| <80 |
25666 ( 36.4) |
25550 ( 32.1) |
51216 ( 34.1) |
| >=80 |
44935 ( 63.6) |
54100 ( 67.9) |
99035 ( 65.9) |
|
70601 ( 47.0) |
79650 ( 53.0) |
150251 (100.0) |
Table 2.2.3.2.14 : DBP (by Gender, Type of Diabetes = Type 2)
| CMH Chi-Square |
p.value |
df |
| 304.35 |
0 |
1 |
|
Barplot 2.2.3.2.12 - DBP (by Gender, Type of Diabetes = Type 2)
|
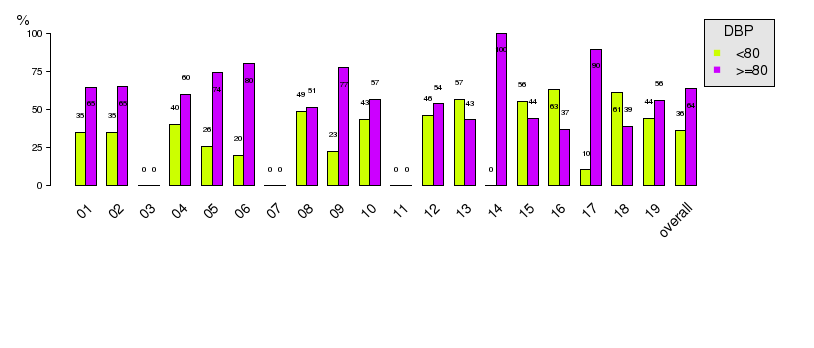
Barplot 2.2.3.2.12a - DBP (by Data Source, Gender = Male, Type of Diabetes=Type 2)
|
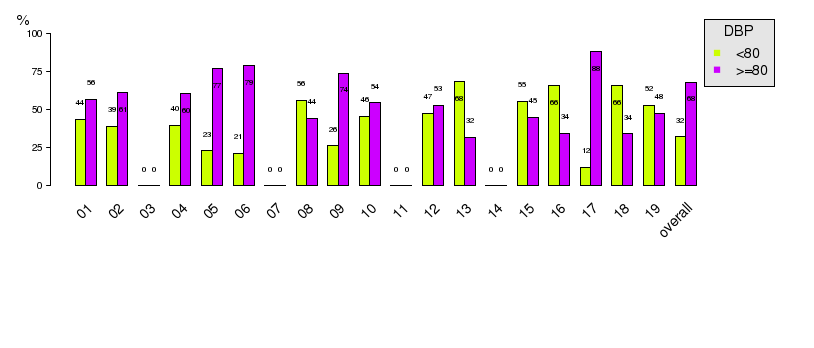
Barplot 2.2.3.2.12b - DBP (by Data Source, Gender = Female, Type of Diabetes=Type 2)
| DBP |
Age |
|
| Valid Value (%) |
NV/NA (%) |
|
| Valid Value |
150251 ( 85.7) |
0 ( 0.0) |
150251 ( 85.7) |
| NV/NA |
24989 ( 14.3) |
0 ( 0.0) |
24989 ( 14.3) |
|
175240 (100.0) |
0 ( 0.0) |
175240 (100.0) |
Table 2.2.3.2.15 : DBP (by Age, Type of Diabetes = Type 2)
| CMH Chi-Square |
p.value |
df |
| 89537.5978 |
0 |
1 |
|
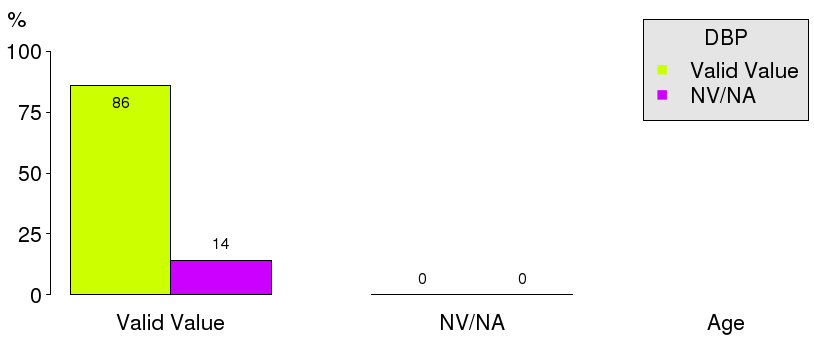
Barplot 2.2.3.2.13 - DBP (by Gender, Type of Diabetes = Type 2)
| DBP |
Age |
|
| <15 (%) |
[15 - 25) (%) |
[25 - 50) (%) |
[50 - 65) (%) |
[65 - 80) (%) |
>=80 (%) |
|
| <80 |
5 ( 45.5) |
43 ( 40.2) |
2991 ( 27.5) |
13829 ( 27.6) |
25538 ( 36.5) |
8810 ( 46.1) |
51216 ( 34.1) |
| >=80 |
6 ( 54.5) |
64 ( 59.8) |
7901 ( 72.5) |
36299 ( 72.4) |
44478 ( 63.5) |
10287 ( 53.9) |
99035 ( 65.9) |
|
11 ( 0.0) |
107 ( 0.1) |
10892 ( 7.2) |
50128 ( 33.4) |
70016 ( 46.6) |
19097 ( 12.7) |
150251 (100.0) |
Table 2.2.3.2.16 : DBP (by Age, Type of Diabetes = Type 2)
| CMH Chi-Square |
p.value |
df |
| 2568.7885 |
0 |
5 |

|
Barplot 2.2.3.2.14 - DBP (by Age, Type of Diabetes = Type 2)
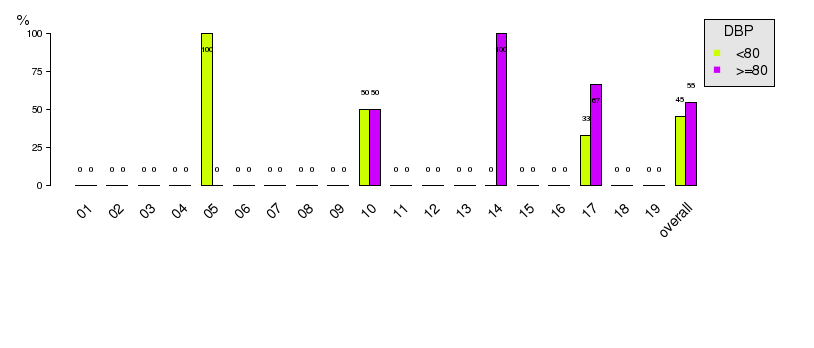
|
Barplot 2.2.3.2.14a - DBP (by Data Source, Age = <15, Type of Diabetes=Type 2)
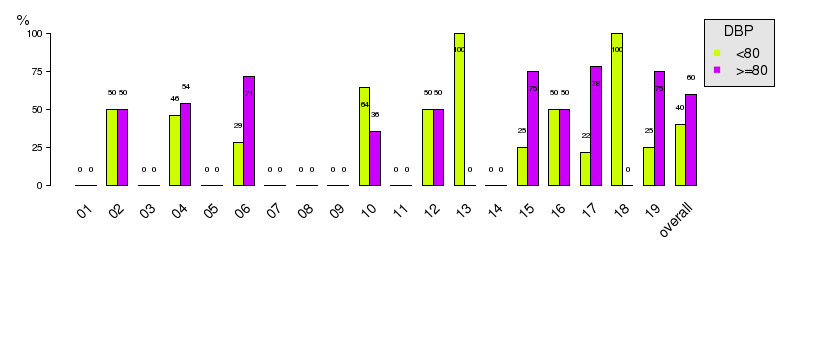
|
Barplot 2.2.3.2.14b - DBP (by Data Source, Age = [15 - 25), Type of Diabetes=Type 2)

|
Barplot 2.2.3.2.14c - DBP (by Data Source, Age = [25 - 50), Type of Diabetes=Type 2)
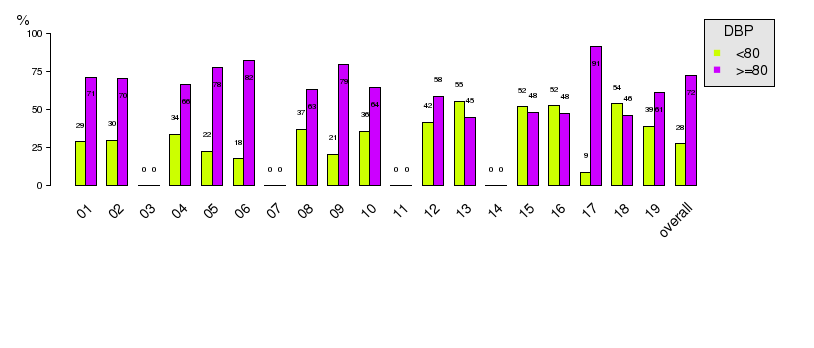
|
Barplot 2.2.3.2.14d - DBP (by Data Source, Age = [50 - 65), Type of Diabetes=Type 2)

|
Barplot 2.2.3.2.14e - DBP (by Data Source, Age = [65 - 80), Type of Diabetes=Type 2)
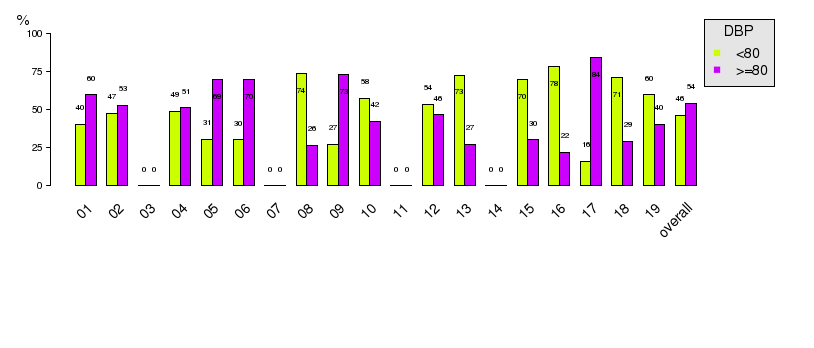
|
Barplot 2.2.3.2.14f - DBP (by Data Source, Age = >=80, Type of Diabetes=Type 2)
| DBP |
Gender * Age |
|
| Valid Value |
NV/NA |
|
Valid Value (%) |
NV/NA (%) |
Valid Value (%) |
NV/NA (%) |
|
| Valid Value |
150251 ( 85.7) |
0 ( 0.0) |
0 ( 0.0) |
0 ( 0.0) |
150251 ( 85.7) |
| NV/NA |
24989 ( 14.3) |
0 ( 0.0) |
0 ( 0.0) |
0 ( 0.0) |
24989 ( 14.3) |
|
175240 (100.0) |
0 ( 0.0) |
0 ( 0.0) |
0 ( 0.0) |
175240 (100.0) |
Table 2.2.3.2.17 : DBP (by Gender * Age, Type of Diabetes = Type 2)
| DBP |
Gender * Age |
|
| <15 |
[15 - 25) |
[25 - 50) |
[50 - 65) |
[65 - 80) |
>=80 |
|
Male (%) |
Female (%) |
Male (%) |
Female (%) |
Male (%) |
Female (%) |
Male (%) |
Female (%) |
Male (%) |
Female (%) |
Male (%) |
Female (%) |
|
| <80 |
2 ( 66.7) |
3 ( 37.5) |
28 ( 43.1) |
15 ( 35.7) |
1351 ( 30.0) |
1640 ( 25.7) |
6342 ( 26.7) |
7487 ( 28.4) |
12693 ( 32.5) |
12845 ( 41.4) |
5134 ( 41.7) |
3676 ( 54.1) |
51216 ( 34.1) |
| >=80 |
1 ( 33.3) |
5 ( 62.5) |
37 ( 56.9) |
27 ( 64.3) |
3154 ( 70.0) |
4747 ( 74.3) |
17403 ( 73.3) |
18896 ( 71.6) |
26332 ( 67.5) |
18146 ( 58.6) |
7173 ( 58.3) |
3114 ( 45.9) |
99035 ( 65.9) |
|
3 ( 0.0) |
8 ( 0.0) |
65 ( 0.0) |
42 ( 0.0) |
4505 ( 3.0) |
6387 ( 4.3) |
23745 ( 15.8) |
26383 ( 17.6) |
39025 ( 26.0) |
30991 ( 20.6) |
12307 ( 8.2) |
6790 ( 4.5) |
150251 (100.0) |
Table 2.2.3.2.18 : DBP (by Gender * Age, Type of Diabetes = Type 2)
| CMH Chi-Square |
p.value |
df |
| 208025.7557 |
0 |
23 |
| DBP |
Gender |
|
| Valid Value (%) |
NV/NA (%) |
|
| Valid Value |
2753 ( 71.1) |
0 ( 0.0) |
2753 ( 71.1) |
| NV/NA |
1117 ( 28.9) |
0 ( 0.0) |
1117 ( 28.9) |
|
3870 (100.0) |
0 ( 0.0) |
3870 (100.0) |
Table 2.2.3.2.19 : DBP (by Gender, Type of Diabetes = Other Type)
| CMH Chi-Square |
p.value |
df |
| 691.601 |
0 |
1 |
|
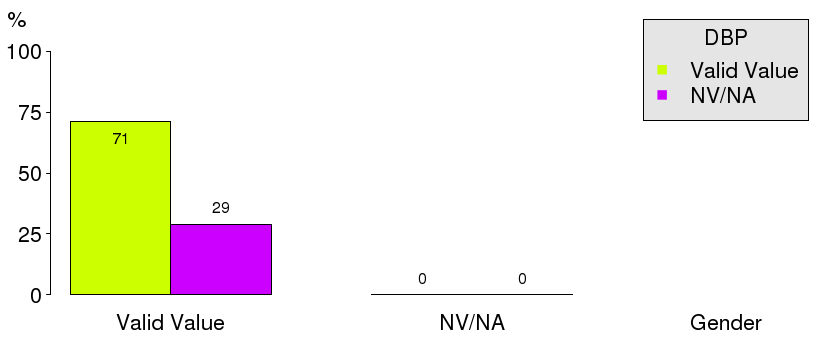
Barplot 2.2.3.2.15 - DBP (by Gender, Type of Diabetes = Other Type)
| DBP |
Gender |
|
| Male (%) |
Female (%) |
|
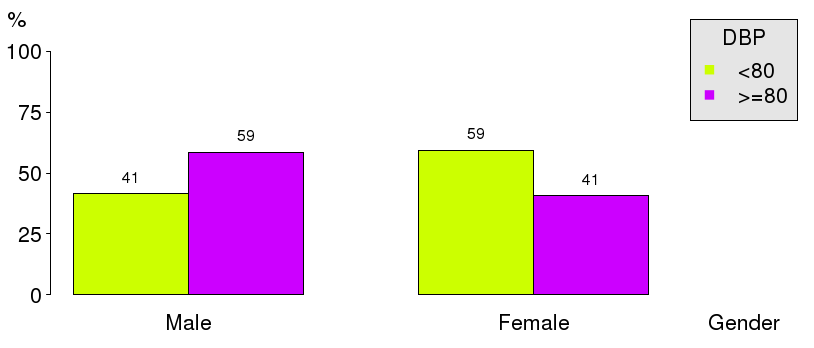
| <80 |
486 ( 41.4) |
938 ( 59.4) |
1424 ( 51.7) |
| >=80 |
687 ( 58.6) |
642 ( 40.6) |
1329 ( 48.3) |
|
1173 ( 42.6) |
1580 ( 57.4) |
2753 (100.0) |
Table 2.2.3.2.20 : DBP (by Gender, Type of Diabetes = Other Type)
| CMH Chi-Square |
p.value |
df |
| 86.0039 |
0 |
1 |
|
Barplot 2.2.3.2.16 - DBP (by Gender, Type of Diabetes = Other Type)
|
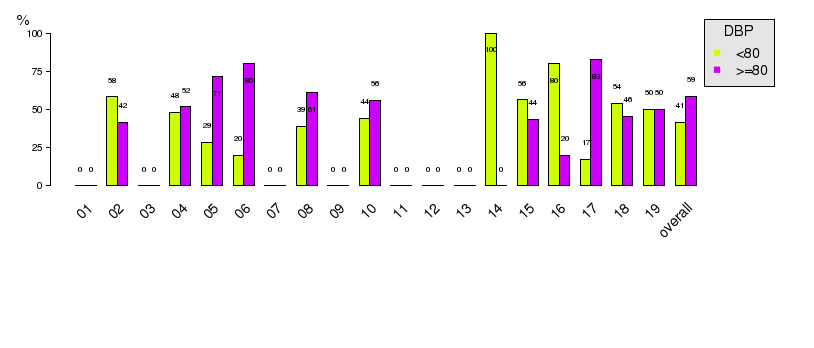
Barplot 2.2.3.2.16a - DBP (by Data Source, Gender = Male, Type of Diabetes=Other Type)
|
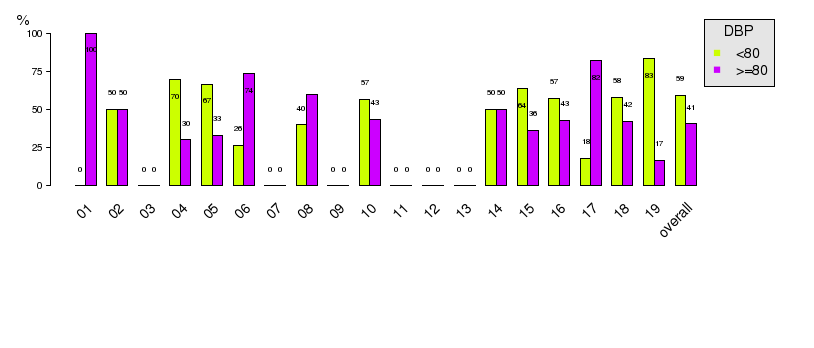
Barplot 2.2.3.2.16b - DBP (by Data Source, Gender = Female, Type of Diabetes=Other Type)
| DBP |
Age |
|
| Valid Value (%) |
NV/NA (%) |
|
| Valid Value |
2753 ( 71.1) |
0 ( 0.0) |
2753 ( 71.1) |
| NV/NA |
1117 ( 28.9) |
0 ( 0.0) |
1117 ( 28.9) |
|
3870 (100.0) |
0 ( 0.0) |
3870 (100.0) |
Table 2.2.3.2.21 : DBP (by Age, Type of Diabetes = Other Type)
| CMH Chi-Square |
p.value |
df |
| 691.601 |
0 |
1 |

|
Barplot 2.2.3.2.17 - DBP (by Gender, Type of Diabetes = Other Type)
| DBP |
Age |
|
| <15 (%) |
[15 - 25) (%) |
[25 - 50) (%) |
[50 - 65) (%) |
[65 - 80) (%) |
>=80 (%) |
|
| <80 |
6 ( 85.7) |
52 ( 78.8) |
639 ( 60.9) |
315 ( 40.5) |
321 ( 45.7) |
91 ( 60.3) |
1424 ( 51.7) |
| >=80 |
1 ( 14.3) |
14 ( 21.2) |
411 ( 39.1) |
462 ( 59.5) |
381 ( 54.3) |
60 ( 39.7) |
1329 ( 48.3) |
|
7 ( 0.3) |
66 ( 2.4) |
1050 ( 38.1) |
777 ( 28.2) |
702 ( 25.5) |
151 ( 5.5) |
2753 (100.0) |
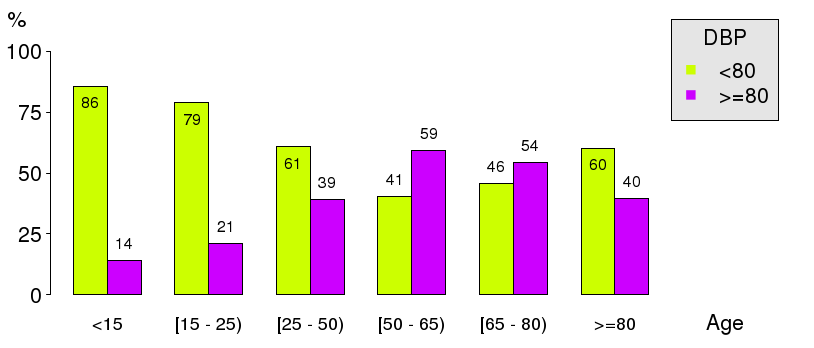
Table 2.2.3.2.22 : DBP (by Age, Type of Diabetes = Other Type)
| CMH Chi-Square |
p.value |
df |
| 111.1161 |
0 |
5 |
|
Barplot 2.2.3.2.18 - DBP (by Age, Type of Diabetes = Other Type)
|
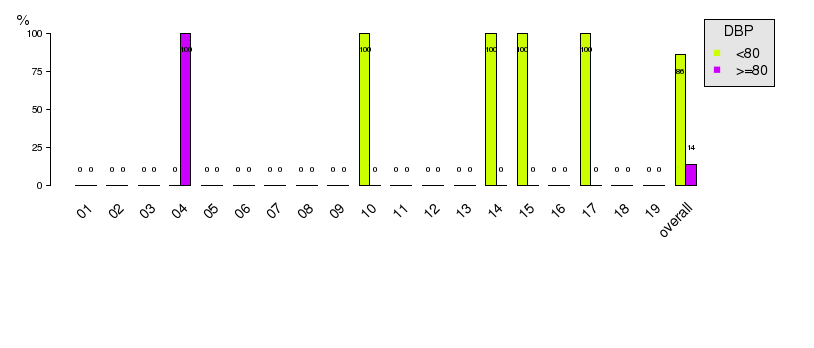
Barplot 2.2.3.2.18a - DBP (by Data Source, Age = <15, Type of Diabetes=Other Type)
|
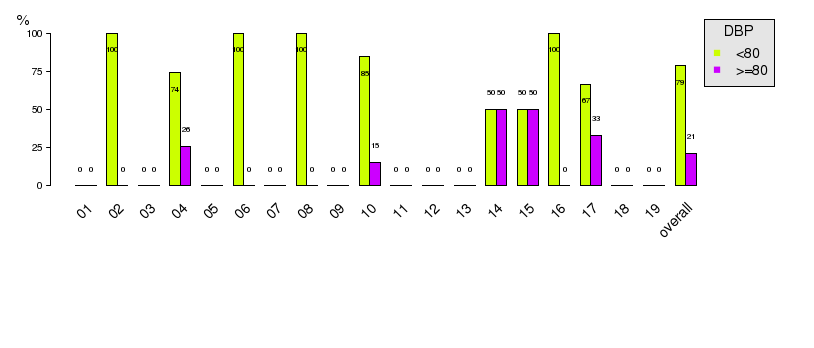
Barplot 2.2.3.2.18b - DBP (by Data Source, Age = [15 - 25), Type of Diabetes=Other Type)
|
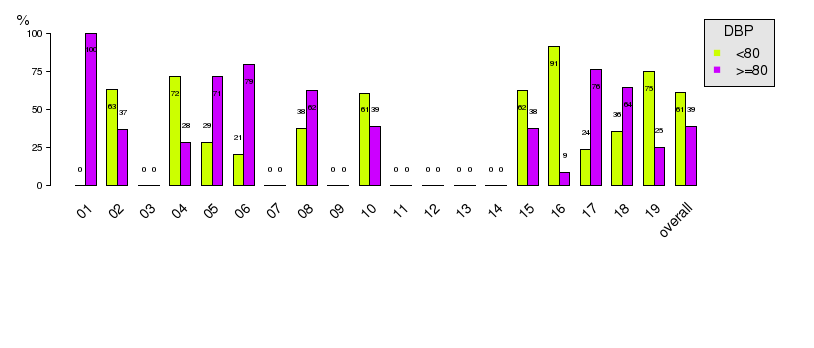
Barplot 2.2.3.2.18c - DBP (by Data Source, Age = [25 - 50), Type of Diabetes=Other Type)
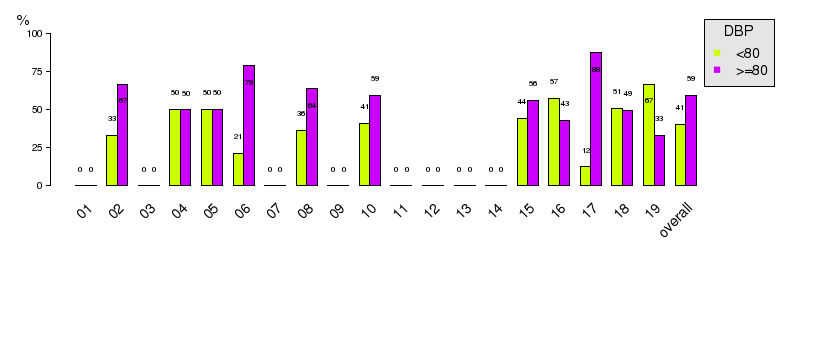
|
Barplot 2.2.3.2.18d - DBP (by Data Source, Age = [50 - 65), Type of Diabetes=Other Type)
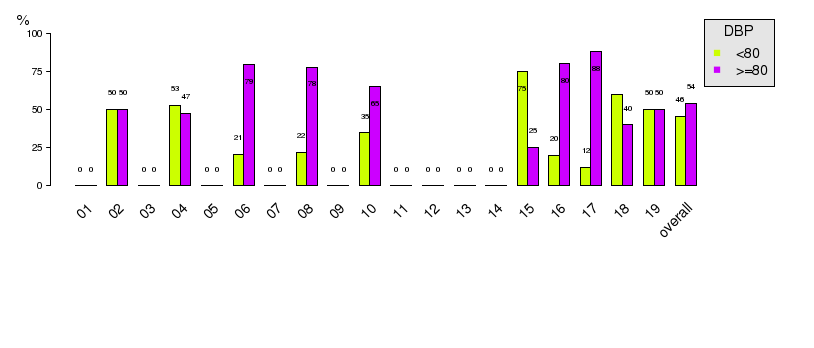
|
Barplot 2.2.3.2.18e - DBP (by Data Source, Age = [65 - 80), Type of Diabetes=Other Type)
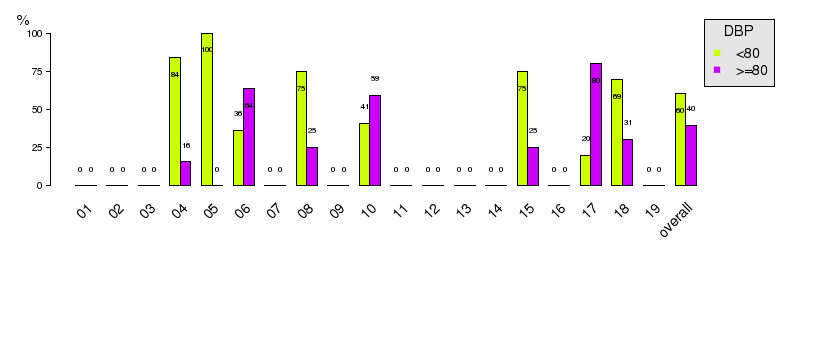
|
Barplot 2.2.3.2.18f - DBP (by Data Source, Age = >=80, Type of Diabetes=Other Type)
| DBP |
Gender * Age |
|
| Valid Value |
NV/NA |
|
Valid Value (%) |
NV/NA (%) |
Valid Value (%) |
NV/NA (%) |
|
| Valid Value |
2753 ( 71.1) |
0 ( 0.0) |
0 ( 0.0) |
0 ( 0.0) |
2753 ( 71.1) |
| NV/NA |
1117 ( 28.9) |
0 ( 0.0) |
0 ( 0.0) |
0 ( 0.0) |
1117 ( 28.9) |
|
3870 (100.0) |
0 ( 0.0) |
0 ( 0.0) |
0 ( 0.0) |
3870 (100.0) |
Table 2.2.3.2.23 : DBP (by Gender * Age, Type of Diabetes = Other Type)
| DBP |
Gender * Age |
|
| <15 |
[15 - 25) |
[25 - 50) |
[50 - 65) |
[65 - 80) |
>=80 |
|
Male (%) |
Female (%) |
Male (%) |
Female (%) |
Male (%) |
Female (%) |
Male (%) |
Female (%) |
Male (%) |
Female (%) |
Male (%) |
Female (%) |
|
| <80 |
4 ( 80.0) |
2 (100.0) |
47 ( 77.0) |
5 (100.0) |
554 ( 69.2) |
85 ( 34.1) |
137 ( 44.6) |
178 ( 37.9) |
148 ( 46.2) |
173 ( 45.3) |
48 ( 55.8) |
43 ( 66.2) |
1424 ( 51.7) |
| >=80 |
1 ( 20.0) |
0 ( 0.0) |
14 ( 23.0) |
0 ( 0.0) |
247 ( 30.8) |
164 ( 65.9) |
170 ( 55.4) |
292 ( 62.1) |
172 ( 53.8) |
209 ( 54.7) |
38 ( 44.2) |
22 ( 33.8) |
1329 ( 48.3) |
|
5 ( 0.2) |
2 ( 0.1) |
61 ( 2.2) |
5 ( 0.2) |
801 ( 29.1) |
249 ( 9.0) |
307 ( 11.2) |
470 ( 17.1) |
320 ( 11.6) |
382 ( 13.9) |
86 ( 3.1) |
65 ( 2.4) |
2753 (100.0) |
Table 2.2.3.2.24 : DBP (by Gender * Age, Type of Diabetes = Other Type)
| CMH Chi-Square |
p.value |
df |
| 3351.988 |
0 |
23 |
|
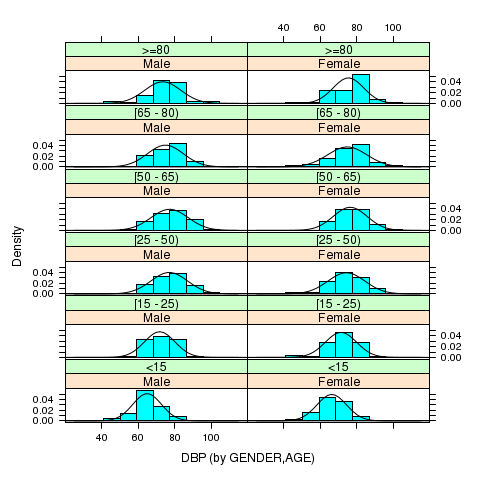
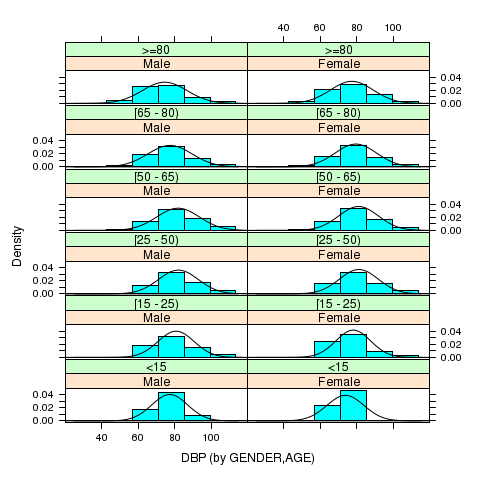
Trellis Barplot: 2.2.3.2.254 - DBP * Gender * Age (Type of Diabetes = Type 1)
|
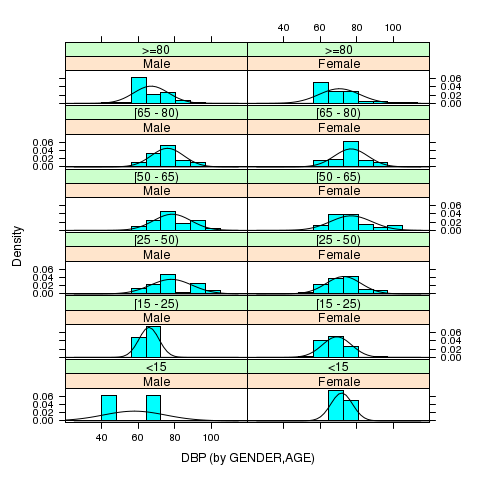
Trellis Barplot: 2.2.3.2.255 - DBP * Gender * Age (Type of Diabetes = Type 2)
|
Trellis Barplot: 2.2.3.2.256 - DBP * Gender * Age (Type of Diabetes = Other Type)
|
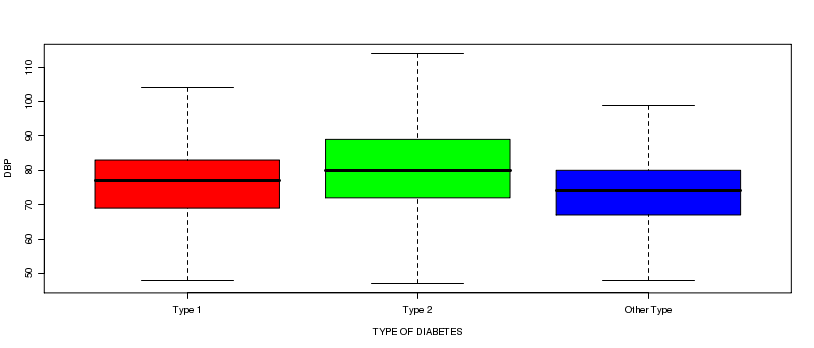
Boxplot: 2.2.3.2.1 - DBP (by Type of Diabetes)
|
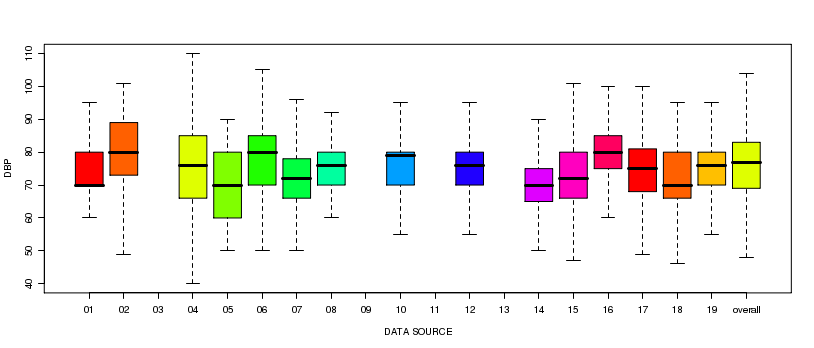
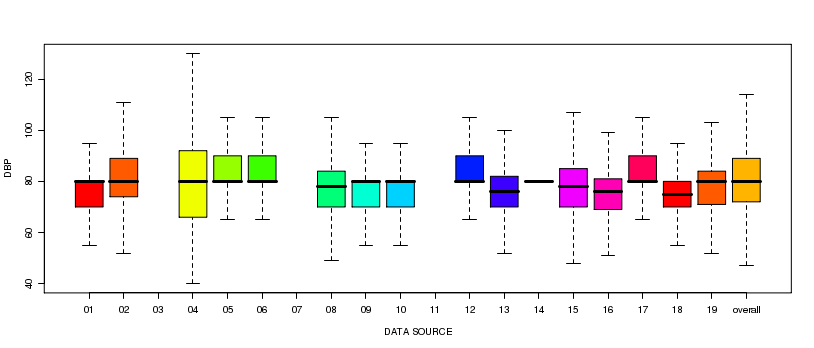
Boxplot: 2.2.3.2.2 - DBP (by Data source, Type of Diabetes = Type 1)
|
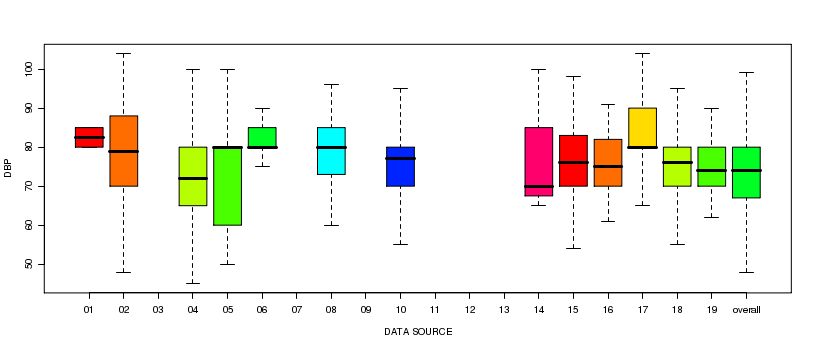
Boxplot: 2.2.3.2.3 - DBP (by Data source, Type of Diabetes = Type 2)
|
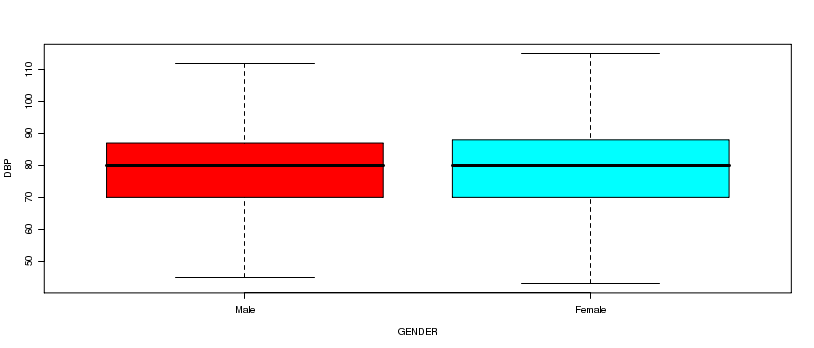
Boxplot: 2.2.3.2.4 - DBP (by Data source, Type of Diabetes = Other Type)
|
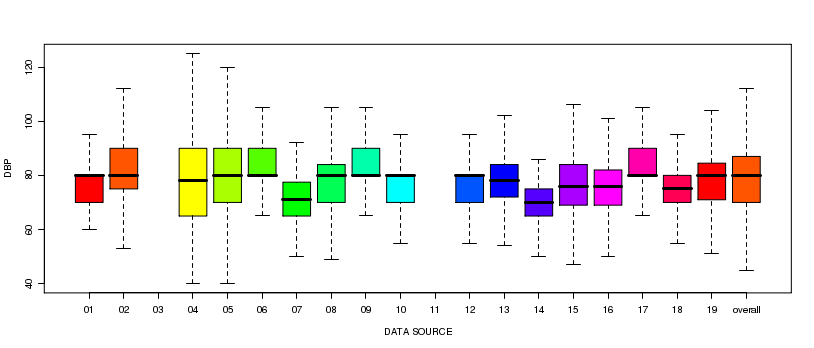
Boxplot: 2.2.3.2.5 - DBP (by Gender)
|
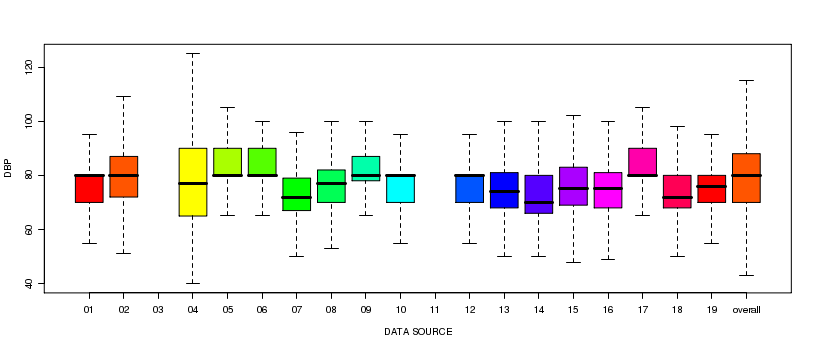
Boxplot: 2.2.3.2.6 - DBP (by Data source, Gender = Male)
|
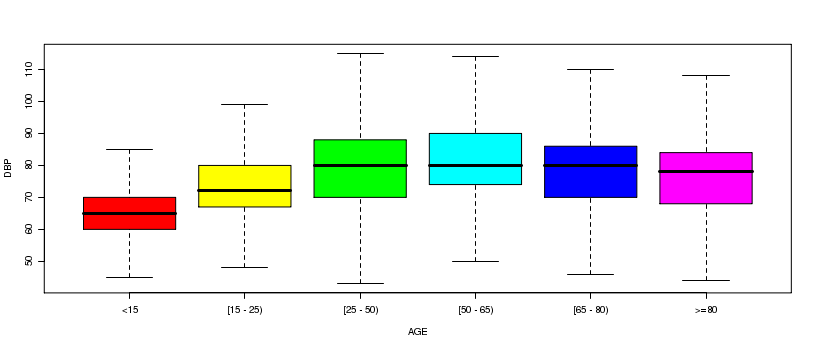
Boxplot: 2.2.3.2.7 - DBP (by Data source, Gender = Female)
|
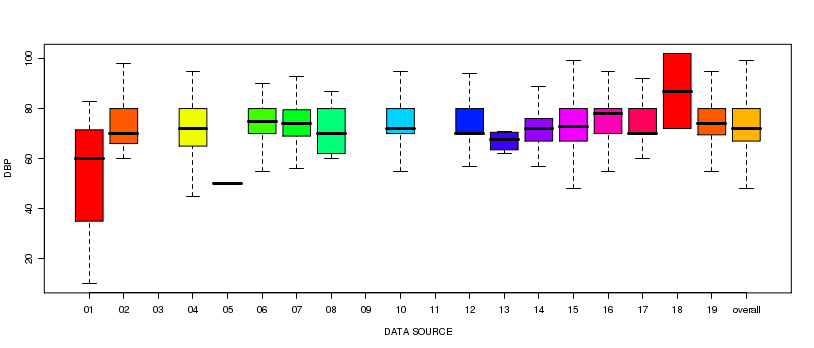
Boxplot: 2.2.3.2.8 - DBP (by Age)
|
Boxplot: 2.2.3.2.9 - DBP (by Data source, Age = [15 - 25))

|
Boxplot: 2.2.3.2.10 - DBP (by Data source, Age = [25 - 50))

|
Boxplot: 2.2.3.2.11 - DBP (by Data source, Age = [50 - 65))

|
Boxplot: 2.2.3.2.12 - DBP (by Data source, Age = [65 - 80))

|
Boxplot: 2.2.3.2.13 - DBP (by Data source, Age = >=80)

|
Boxplot: 2.2.3.2.14 - DBP (by Data source, Age = <15)

|
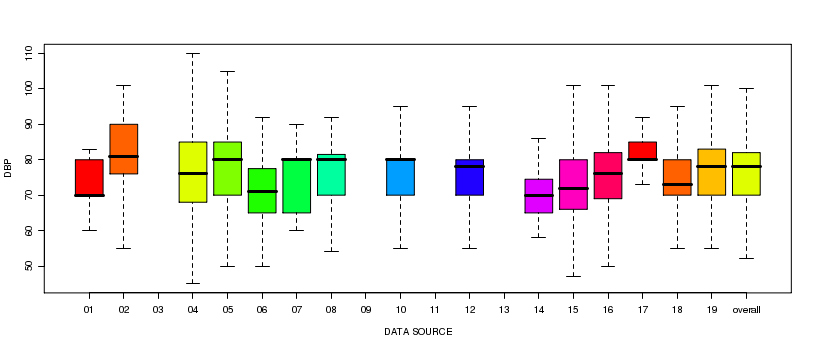
Boxplot: 2.2.3.2.15 - DBP (by Gender, Type of Diabetes = Type 1)
|
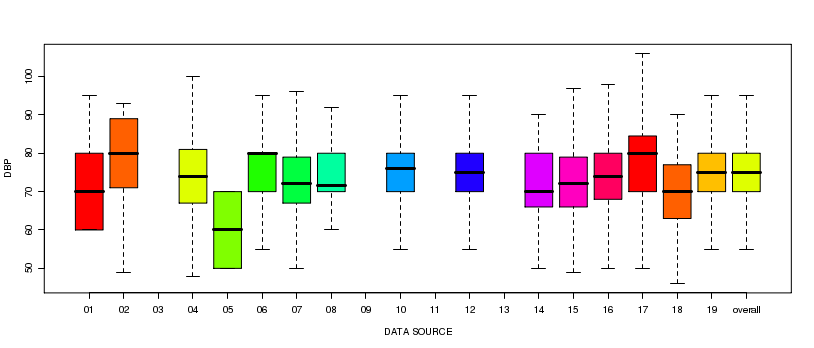
Boxplot: 2.2.3.2.16 - DBP (by Data source, Gender = Male, Type of Diabetes = Type 1)
|
Boxplot: 2.2.3.2.17 - DBP (by Data source, Gender = Female, Type of Diabetes = Type 1)

|
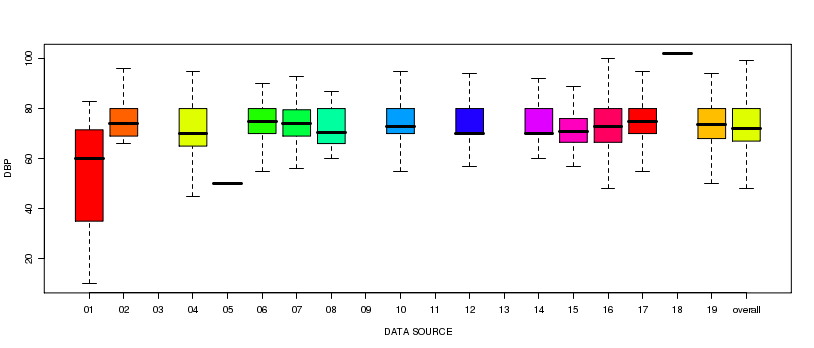
Boxplot: 2.2.3.2.18 - DBP (by Age, Type of Diabetes = Type 1)
|
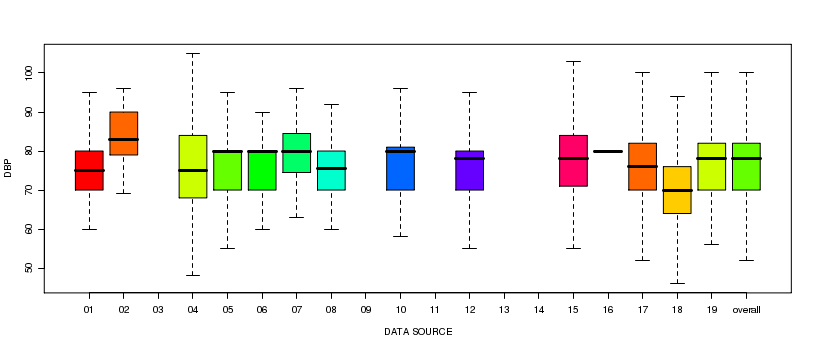
Boxplot: 2.2.3.2.19 - DBP (by Data source, Age = [15 - 25), Type of Diabetes = Type 1)
|
Boxplot: 2.2.3.2.20 - DBP (by Data source, Age = [25 - 50), Type of Diabetes = Type 1)

|
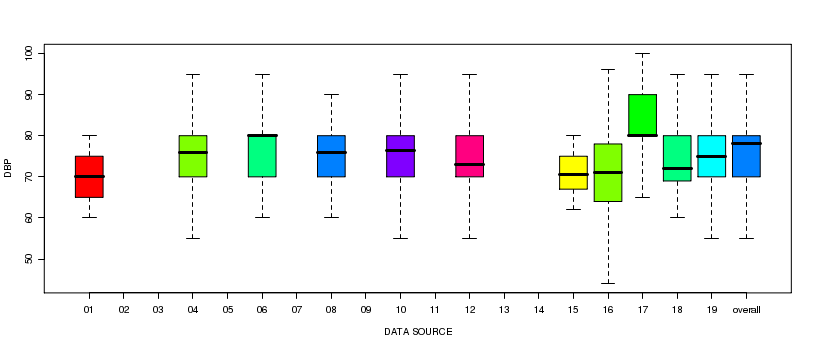
Boxplot: 2.2.3.2.21 - DBP (by Data source, Age = [50 - 65), Type of Diabetes = Type 1)
|
Boxplot: 2.2.3.2.22 - DBP (by Data source, Age = [65 - 80), Type of Diabetes = Type 1)
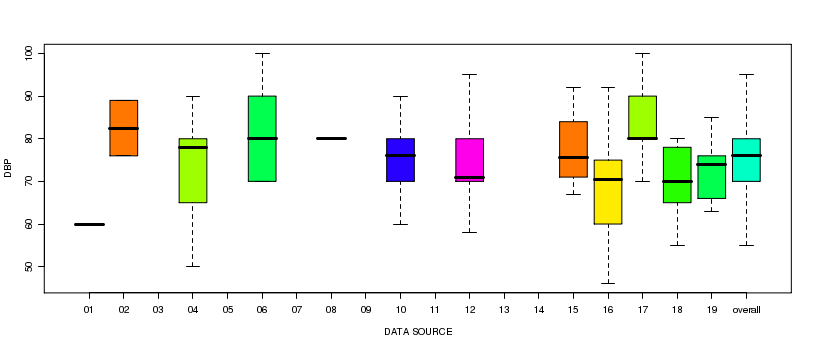
|
Boxplot: 2.2.3.2.23 - DBP (by Data source, Age = >=80, Type of Diabetes = Type 1)
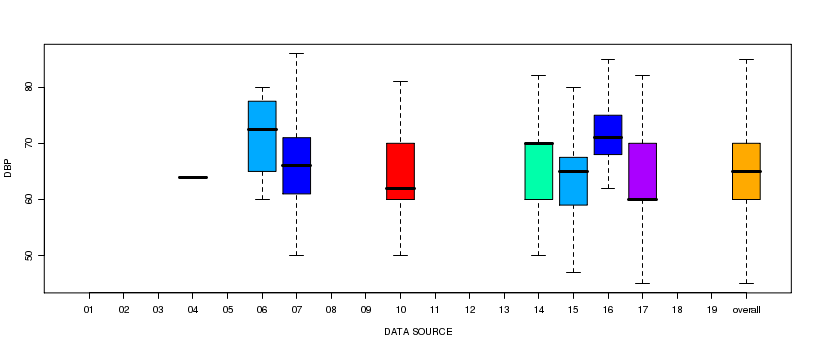
|
Boxplot: 2.2.3.2.24 - DBP (by Data source, Age = <15, Type of Diabetes = Type 1)
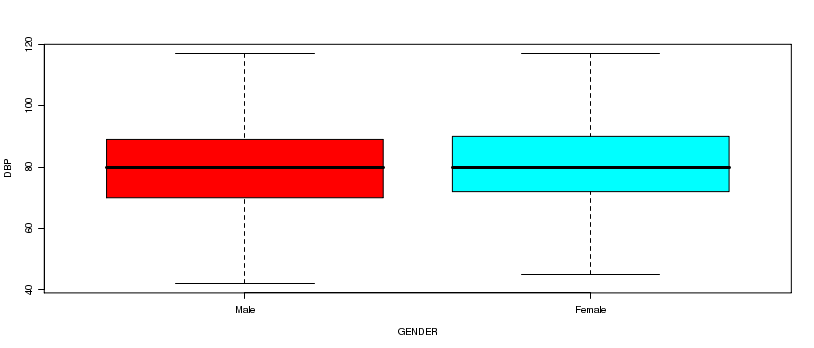
|
Boxplot: 2.2.3.2.25 - DBP (by Gender, Type of Diabetes = Type 2)
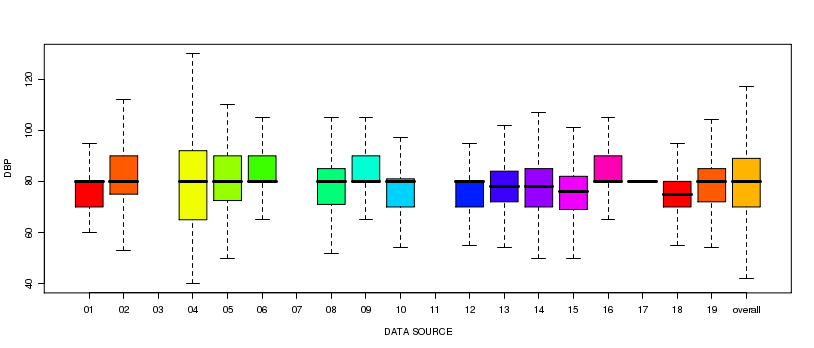
|
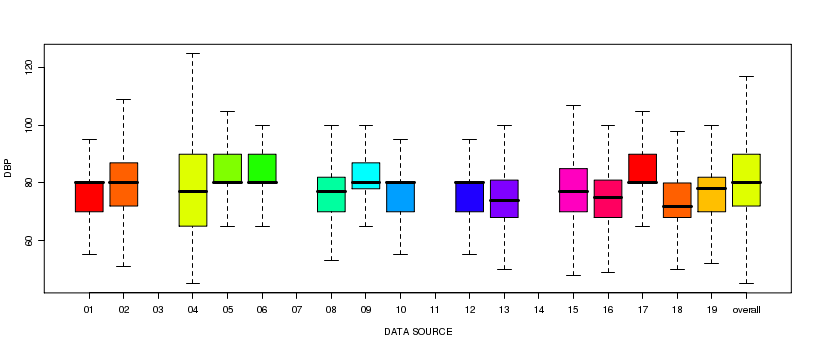
Boxplot: 2.2.3.2.26 - DBP (by Data source, Gender = Male, Type of Diabetes = Type 2)
|
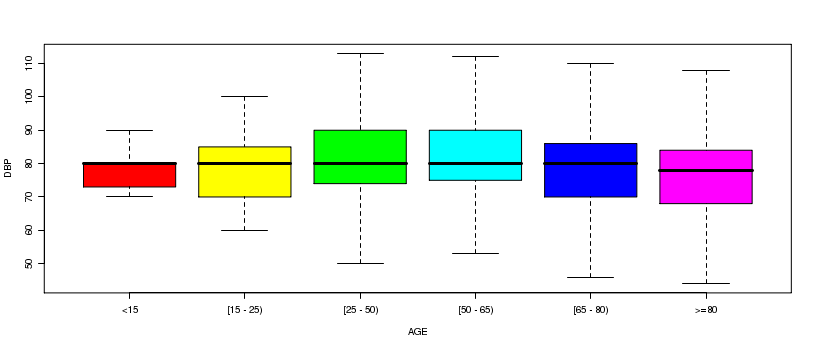
Boxplot: 2.2.3.2.27 - DBP (by Data source, Gender = Female, Type of Diabetes = Type 2)
|
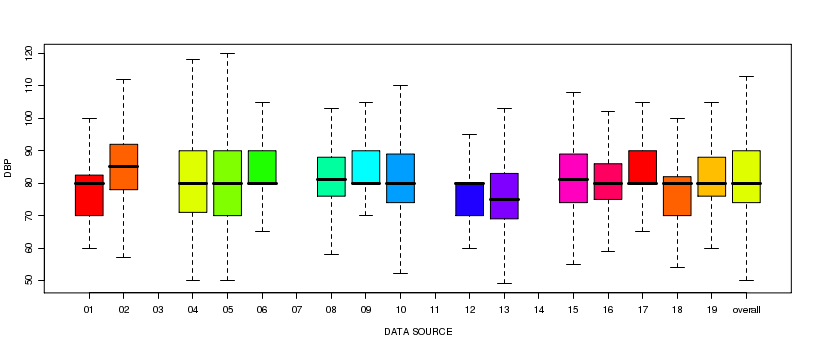
Boxplot: 2.2.3.2.28 - DBP (by Age, Type of Diabetes = Type 2)
|
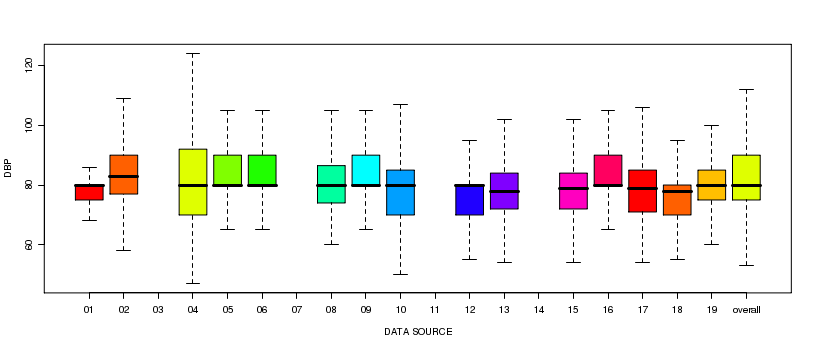
Boxplot: 2.2.3.2.29 - DBP (by Data source, Age = [25 - 50), Type of Diabetes = Type 2)
|
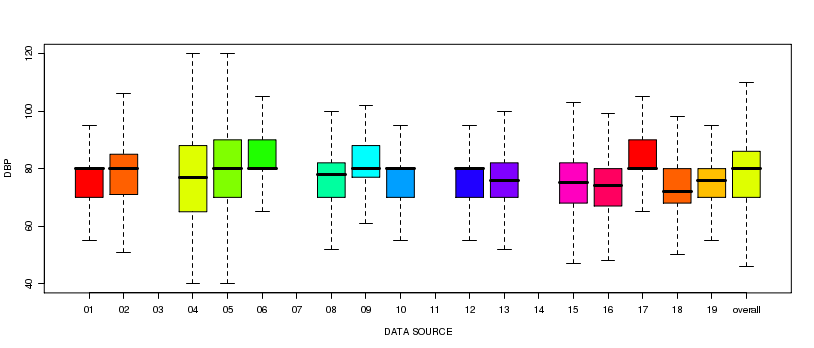
Boxplot: 2.2.3.2.30 - DBP (by Data source, Age = [50 - 65), Type of Diabetes = Type 2)
|
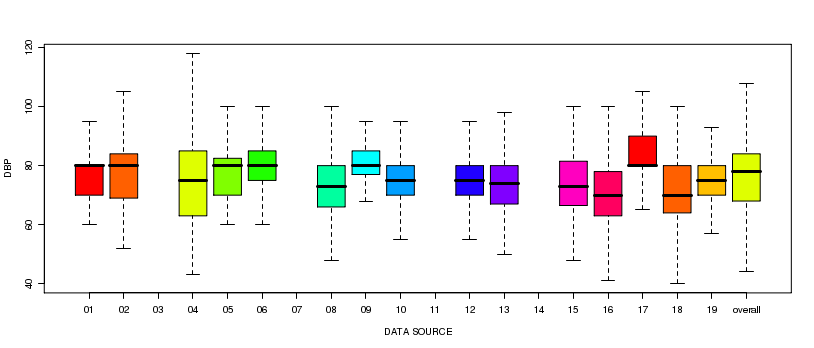
Boxplot: 2.2.3.2.31 - DBP (by Data source, Age = [65 - 80), Type of Diabetes = Type 2)
|
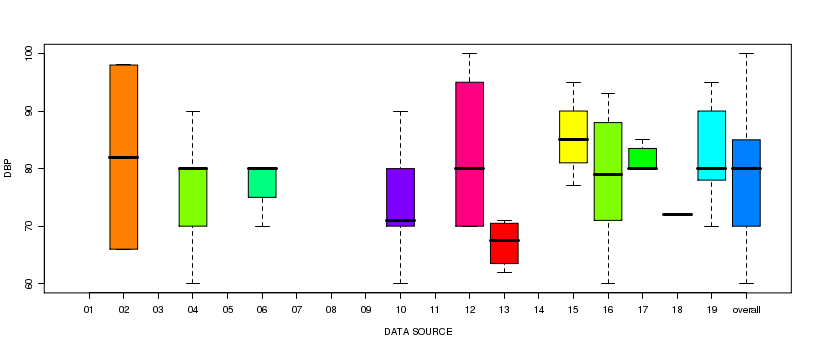
Boxplot: 2.2.3.2.32 - DBP (by Data source, Age = >=80, Type of Diabetes = Type 2)
|
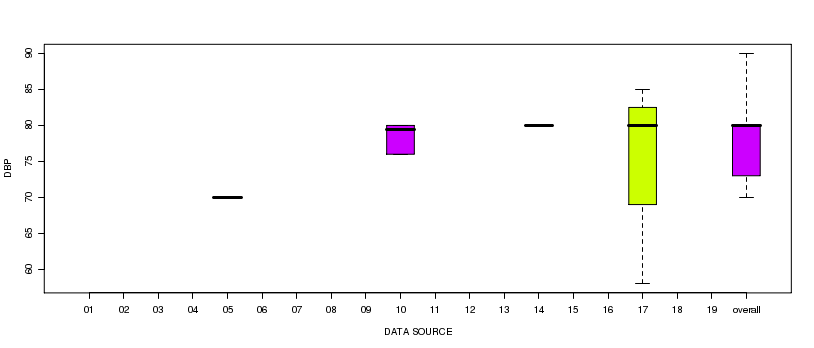
Boxplot: 2.2.3.2.33 - DBP (by Data source, Age = [15 - 25), Type of Diabetes = Type 2)
|
Boxplot: 2.2.3.2.34 - DBP (by Data source, Age = <15, Type of Diabetes = Type 2)
|
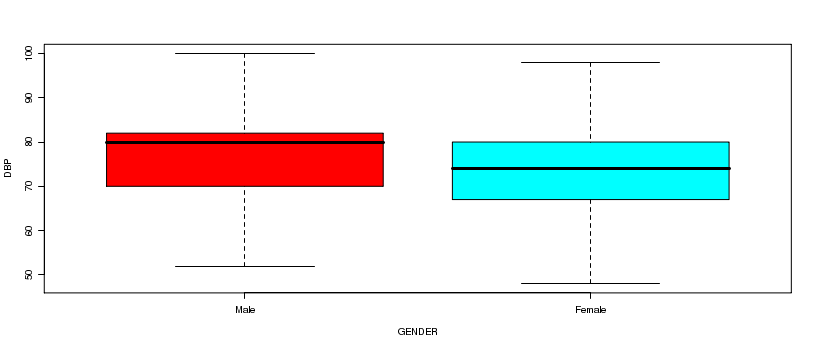
Boxplot: 2.2.3.2.35 - DBP (by Gender, Type of Diabetes = Other Type)
|
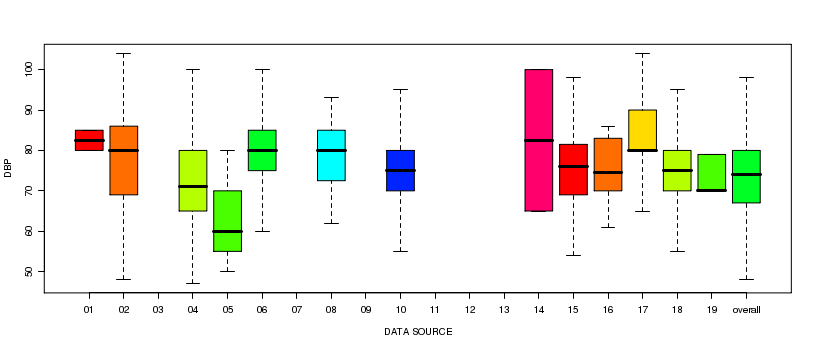
Boxplot: 2.2.3.2.36 - DBP (by Data source, Gender = Female, Type of Diabetes = Other Type)
|
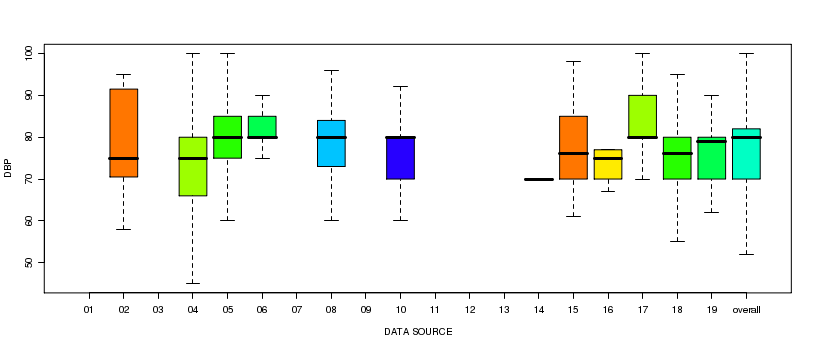
Boxplot: 2.2.3.2.37 - DBP (by Data source, Gender = Male, Type of Diabetes = Other Type)
|
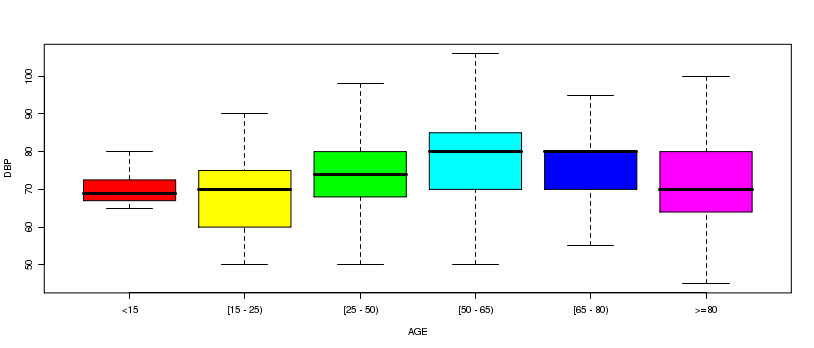
Boxplot: 2.2.3.2.38 - DBP (by Age, Type of Diabetes = Other Type)
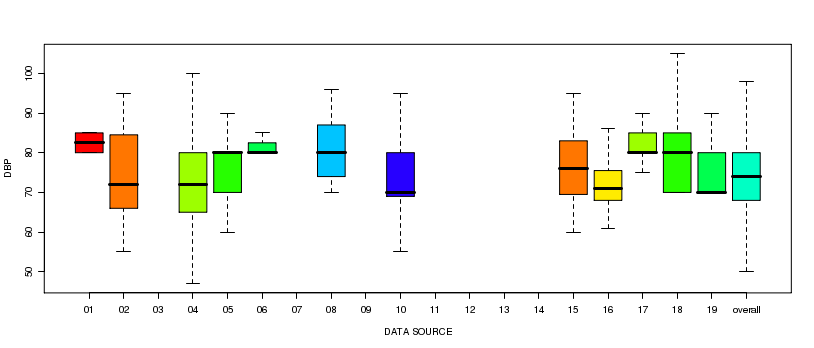
|
Boxplot: 2.2.3.2.39 - DBP (by Data source, Age = [25 - 50), Type of Diabetes = Other Type)
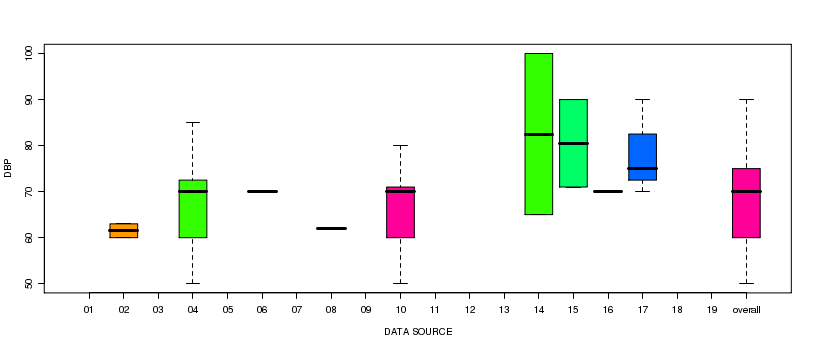
|
Boxplot: 2.2.3.2.40 - DBP (by Data source, Age = [15 - 25), Type of Diabetes = Other Type)
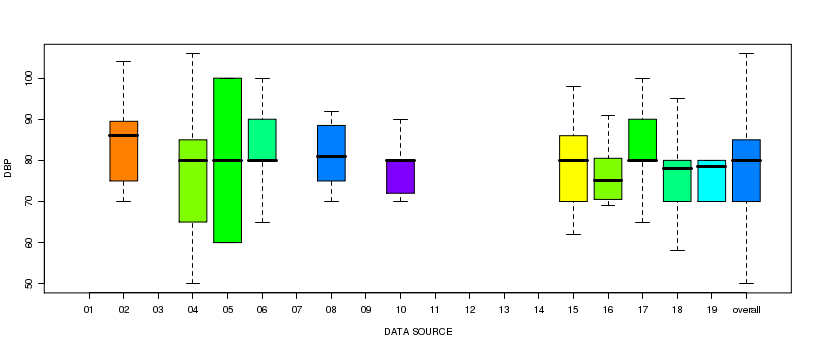
|
Boxplot: 2.2.3.2.41 - DBP (by Data source, Age = [50 - 65), Type of Diabetes = Other Type)
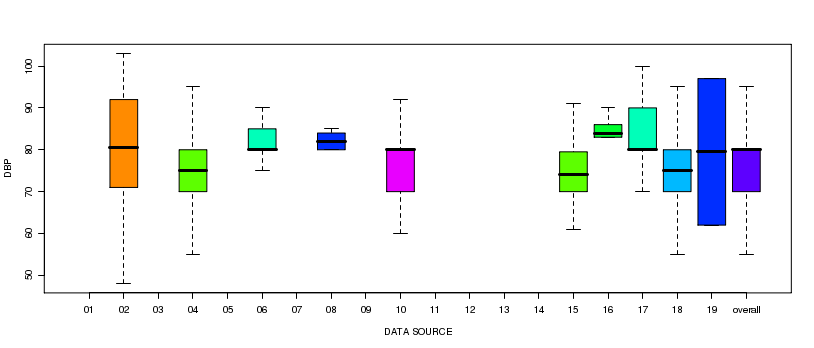
|
Boxplot: 2.2.3.2.42 - DBP (by Data source, Age = [65 - 80), Type of Diabetes = Other Type)
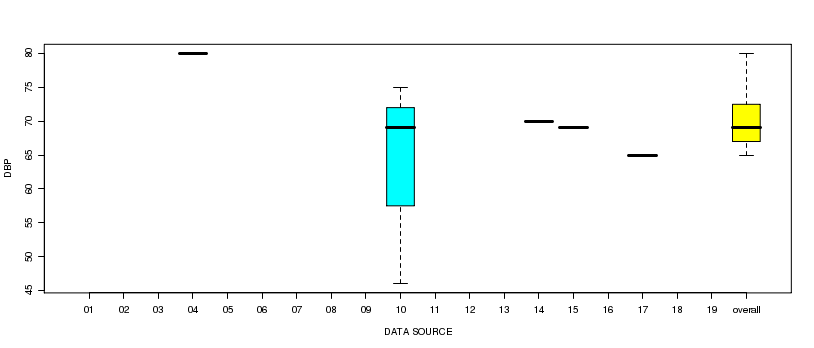
|
Boxplot: 2.2.3.2.43 - DBP (by Data source, Age = <15, Type of Diabetes = Other Type)
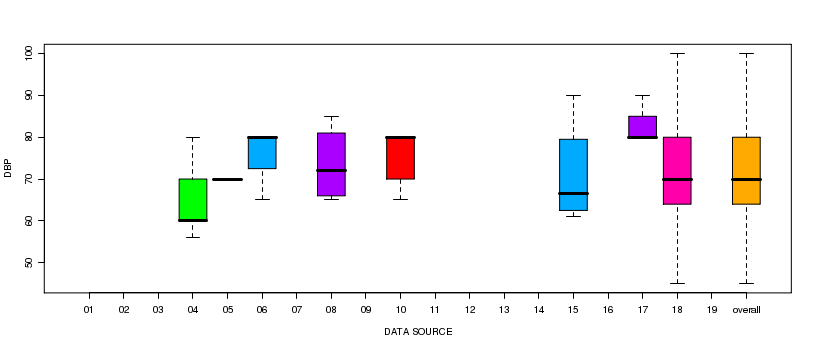
|
Boxplot: 2.2.3.2.44 - DBP (by Data source, Age = >=80, Type of Diabetes = Other Type)
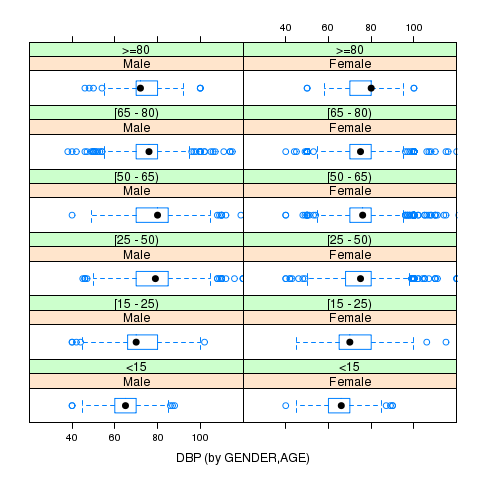
|
Trellis Boxplot: 2.2.3.2.45 - DBP * Gender * Age (Type of Diabetes = Type 1)

|
Trellis Boxplot: 2.2.3.2.46 - DBP * Gender * Age (Type of Diabetes = Type 2)
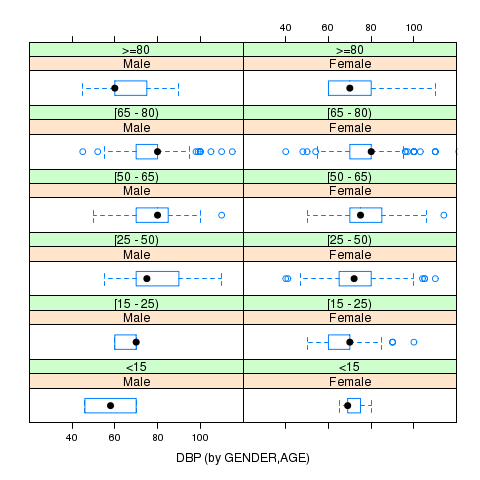
|
Trellis Boxplot: 2.2.3.2.47 - DBP * Gender * Age (Type of Diabetes = Other Type)
