| SBP |
Valid Value (%) |
NV/NA (%) |
|
| Valid Value |
170046 ( 85.2) |
0 ( 0.0) |
170046 ( 85.2) |
| NV/NA |
29473 ( 14.8) |
0 ( 0.0) |
29473 ( 14.8) |
|
199519 (100.0) |
0 ( 0.0) |
199519 (100.0) |
Table 2.2.3.1.1 : SBP (by Type of Diabetes)
| CMH Chi-Square |
p.value |
df |
| 99042.0377 |
0 |
1 |

|
Barplot 2.2.3.1.1 - SBP (by Type of Diabetes)
| SBP |
Type 1 (%) |
Type 2 (%) |
Other Type (%) |
|
| <130 |
8944 ( 52.8) |
35408 ( 23.5) |
1407 ( 51.1) |
45759 ( 26.9) |
| >=130 |
7980 ( 47.2) |
114960 ( 76.5) |
1347 ( 48.9) |
124287 ( 73.1) |
|
16924 ( 10.0) |
150368 ( 88.4) |
2754 ( 1.6) |
170046 (100.0) |
Table 2.2.3.1.2 : SBP (by Type of Diabetes)
| CMH Chi-Square |
p.value |
df |
| 7472.0327 |
0 |
2 |

|
Barplot 2.2.3.1.2 - SBP (by Type of Diabetes)

|
Barplot 2.2.3.1.2a - SBP (by Data Source, Type of Diabetes = Type 1)

|
Barplot 2.2.3.1.2b - SBP (by Data Source, Type of Diabetes = Type 2)

|
Barplot 2.2.3.1.2c - SBP (by Data Source, Type of Diabetes = Other Type)
| SBP |
Valid Value (%) |
NV/NA (%) |
|
| Valid Value |
170046 ( 85.2) |
0 ( 0.0) |
170046 ( 85.2) |
| NV/NA |
29473 ( 14.8) |
0 ( 0.0) |
29473 ( 14.8) |
|
199519 (100.0) |
0 ( 0.0) |
199519 (100.0) |
Table 2.2.3.1.3 : SBP (by Gender)
| CMH Chi-Square |
p.value |
df |
| 99042.0377 |
0 |
1 |

|
Barplot 2.2.3.1.3 - SBP (by Gender)
| SBP |
Male (%) |
Female (%) |
|
| <130 |
23050 ( 28.4) |
22709 ( 25.5) |
45759 ( 26.9) |
| >=130 |
57972 ( 71.6) |
66315 ( 74.5) |
124287 ( 73.1) |
|
81022 ( 47.6) |
89024 ( 52.4) |
170046 (100.0) |
Table 2.2.3.1.4 : SBP (by Gender)
| CMH Chi-Square |
p.value |
df |
| 186.2873 |
0 |
1 |

|
Barplot 2.2.3.1.4 - SBP (by Gender)

|
Barplot 2.2.3.1.4a - SBP (by Data Source, Gender = Male)

|
Barplot 2.2.3.1.4b - SBP (by Data Source, Gender = Female)
| SBP |
Valid Value (%) |
NV/NA (%) |
|
| Valid Value |
170046 ( 85.2) |
0 ( 0.0) |
170046 ( 85.2) |
| NV/NA |
29473 ( 14.8) |
0 ( 0.0) |
29473 ( 14.8) |
|
199519 (100.0) |
0 ( 0.0) |
199519 (100.0) |
Table 2.2.3.1.5 : SBP (by Age)
| CMH Chi-Square |
p.value |
df |
| 99042.0377 |
0 |
1 |

|
Barplot 2.2.3.1.5 - SBP (by Age)
| SBP |
<15 (%) |
[15 - 25) (%) |
[25 - 50) (%) |
[50 - 65) (%) |
[65 - 80) (%) |
>=80 (%) |
|
| <130 |
631 ( 92.7) |
1807 ( 72.8) |
9477 ( 47.5) |
14119 ( 25.7) |
15210 ( 21.0) |
4515 ( 23.2) |
45759 ( 26.9) |
| >=130 |
50 ( 7.3) |
676 ( 27.2) |
10495 ( 52.5) |
40860 ( 74.3) |
57221 ( 79.0) |
14985 ( 76.8) |
124287 ( 73.1) |
|
681 ( 0.4) |
2483 ( 1.5) |
19972 ( 11.7) |
54979 ( 32.3) |
72431 ( 42.6) |
19500 ( 11.5) |
170046 (100.0) |
Table 2.2.3.1.6 : SBP (by Age)
| CMH Chi-Square |
p.value |
df |
| 9905.6745 |
0 |
5 |

|
Barplot 2.2.3.1.6 - SBP (by Age)

|
Barplot 2.2.3.1.6a - SBP (by Data Source, Age = <15)

|
Barplot 2.2.3.1.6b - SBP (by Data Source, Age = [15 - 25))

|
Barplot 2.2.3.1.6c - SBP (by Data Source, Age = [25 - 50))

|
Barplot 2.2.3.1.6d - SBP (by Data Source, Age = [50 - 65))

|
Barplot 2.2.3.1.6e - SBP (by Data Source, Age = [65 - 80))

|
Barplot 2.2.3.1.6f - SBP (by Data Source, Age = >=80)
| SBP |
Gender |
|
| Valid Value (%) |
NV/NA (%) |
|
| Valid Value |
16924 ( 82.9) |
0 ( 0.0) |
16924 ( 82.9) |
| NV/NA |
3485 ( 17.1) |
0 ( 0.0) |
3485 ( 17.1) |
|
20409 (100.0) |
0 ( 0.0) |
20409 (100.0) |
Table 2.2.3.1.7 : SBP (by Gender, Type of Diabetes = Type 1)
| CMH Chi-Square |
p.value |
df |
| 8849.3665 |
0 |
1 |

|
Barplot 2.2.3.1.7 - SBP (by Gender, Type of Diabetes = Type 1)
| SBP |
Gender |
|
| Male (%) |
Female (%) |
|
| <130 |
4525 ( 49.2) |
4419 ( 57.2) |
8944 ( 52.8) |
| >=130 |
4673 ( 50.8) |
3307 ( 42.8) |
7980 ( 47.2) |
|
9198 ( 54.3) |
7726 ( 45.7) |
16924 (100.0) |
Table 2.2.3.1.8 : SBP (by Gender, Type of Diabetes = Type 1)
| CMH Chi-Square |
p.value |
df |
| 107.5503 |
0 |
1 |

|
Barplot 2.2.3.1.8 - SBP (by Gender, Type of Diabetes = Type 1)

|
Barplot 2.2.3.1.8a - SBP (by Data Source, Gender = Male, Type of Diabetes=Type 1)

|
Barplot 2.2.3.1.8b - SBP (by Data Source, Gender = Female, Type of Diabetes=Type 1)
| SBP |
Age |
|
| Valid Value (%) |
NV/NA (%) |
|
| Valid Value |
16924 ( 82.9) |
0 ( 0.0) |
16924 ( 82.9) |
| NV/NA |
3485 ( 17.1) |
0 ( 0.0) |
3485 ( 17.1) |
|
20409 (100.0) |
0 ( 0.0) |
20409 (100.0) |
Table 2.2.3.1.9 : SBP (by Age, Type of Diabetes = Type 1)
| CMH Chi-Square |
p.value |
df |
| 8849.3665 |
0 |
1 |

|
Barplot 2.2.3.1.9 - SBP (by Gender, Type of Diabetes = Type 1)
| SBP |
Age |
|
| <15 (%) |
[15 - 25) (%) |
[25 - 50) (%) |
[50 - 65) (%) |
[65 - 80) (%) |
>=80 (%) |
|
| <130 |
619 ( 93.4) |
1694 ( 73.3) |
4697 ( 58.5) |
1432 ( 35.5) |
433 ( 26.1) |
69 ( 29.0) |
8944 ( 52.8) |
| >=130 |
44 ( 6.6) |
616 ( 26.7) |
3329 ( 41.5) |
2597 ( 64.5) |
1225 ( 73.9) |
169 ( 71.0) |
7980 ( 47.2) |
|
663 ( 3.9) |
2310 ( 13.6) |
8026 ( 47.4) |
4029 ( 23.8) |
1658 ( 9.8) |
238 ( 1.4) |
16924 (100.0) |
Table 2.2.3.1.10 : SBP (by Age, Type of Diabetes = Type 1)
| CMH Chi-Square |
p.value |
df |
| 1943.5194 |
0 |
5 |

|
Barplot 2.2.3.1.10 - SBP (by Age, Type of Diabetes = Type 1)

|
Barplot 2.2.3.1.10a - SBP (by Data Source, Age = <15, Type of Diabetes=Type 1)

|
Barplot 2.2.3.1.10b - SBP (by Data Source, Age = [15 - 25), Type of Diabetes=Type 1)
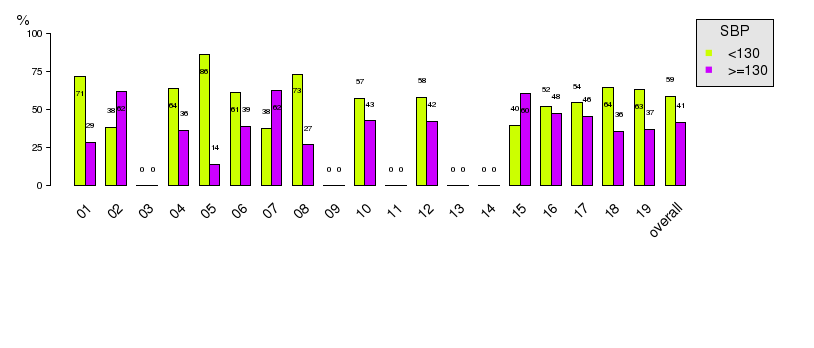
|
Barplot 2.2.3.1.10c - SBP (by Data Source, Age = [25 - 50), Type of Diabetes=Type 1)

|
Barplot 2.2.3.1.10d - SBP (by Data Source, Age = [50 - 65), Type of Diabetes=Type 1)

|
Barplot 2.2.3.1.10e - SBP (by Data Source, Age = [65 - 80), Type of Diabetes=Type 1)
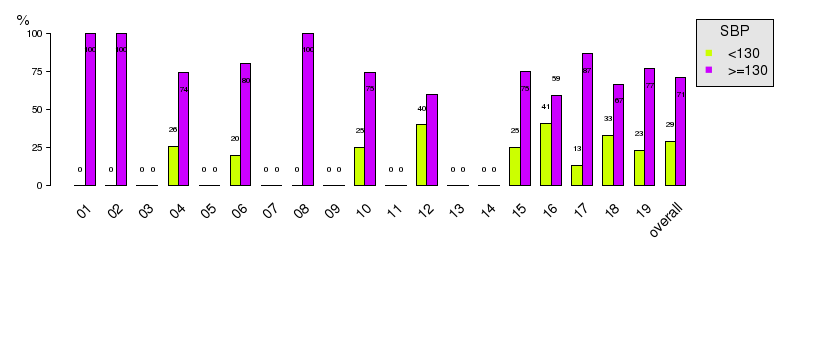
|
Barplot 2.2.3.1.10f - SBP (by Data Source, Age = >=80, Type of Diabetes=Type 1)
| SBP |
Gender * Age |
|
| Valid Value |
NV/NA |
|
Valid Value (%) |
NV/NA (%) |
Valid Value (%) |
NV/NA (%) |
|
| Valid Value |
16924 ( 82.9) |
0 ( 0.0) |
0 ( 0.0) |
0 ( 0.0) |
16924 ( 82.9) |
| NV/NA |
3485 ( 17.1) |
0 ( 0.0) |
0 ( 0.0) |
0 ( 0.0) |
3485 ( 17.1) |
|
20409 (100.0) |
0 ( 0.0) |
0 ( 0.0) |
0 ( 0.0) |
20409 (100.0) |
Table 2.2.3.1.11 : SBP (by Gender * Age, Type of Diabetes = Type 1)
| SBP |
Gender * Age |
|
| <15 |
[15 - 25) |
[25 - 50) |
[50 - 65) |
[65 - 80) |
>=80 |
|
Male (%) |
Female (%) |
Male (%) |
Female (%) |
Male (%) |
Female (%) |
Male (%) |
Female (%) |
Male (%) |
Female (%) |
Male (%) |
Female (%) |
|
| <130 |
292 ( 92.4) |
327 ( 94.2) |
859 ( 81.7) |
835 ( 66.4) |
2324 ( 65.7) |
2373 ( 52.9) |
699 ( 38.5) |
733 ( 33.1) |
205 ( 23.6) |
228 ( 28.9) |
40 ( 29.0) |
29 ( 29.0) |
8944 ( 52.8) |
| >=130 |
24 ( 7.6) |
20 ( 5.8) |
193 ( 18.3) |
423 ( 33.6) |
1212 ( 34.3) |
2117 ( 47.1) |
1116 ( 61.5) |
1481 ( 66.9) |
664 ( 76.4) |
561 ( 71.1) |
98 ( 71.0) |
71 ( 71.0) |
7980 ( 47.2) |
|
316 ( 1.9) |
347 ( 2.1) |
1052 ( 6.2) |
1258 ( 7.4) |
3536 ( 20.9) |
4490 ( 26.5) |
1815 ( 10.7) |
2214 ( 13.1) |
869 ( 5.1) |
789 ( 4.7) |
138 ( 0.8) |
100 ( 0.6) |
16924 (100.0) |
Table 2.2.3.1.12 : SBP (by Gender * Age, Type of Diabetes = Type 1)
| CMH Chi-Square |
p.value |
df |
| 17335.4328 |
0 |
23 |
| SBP |
Gender |
|
| Valid Value (%) |
NV/NA (%) |
|
| Valid Value |
150368 ( 85.8) |
0 ( 0.0) |
150368 ( 85.8) |
| NV/NA |
24872 ( 14.2) |
0 ( 0.0) |
24872 ( 14.2) |
|
175240 (100.0) |
0 ( 0.0) |
175240 (100.0) |
Table 2.2.3.1.13 : SBP (by Gender, Type of Diabetes = Type 2)
| CMH Chi-Square |
p.value |
df |
| 89872.4379 |
0 |
1 |

|
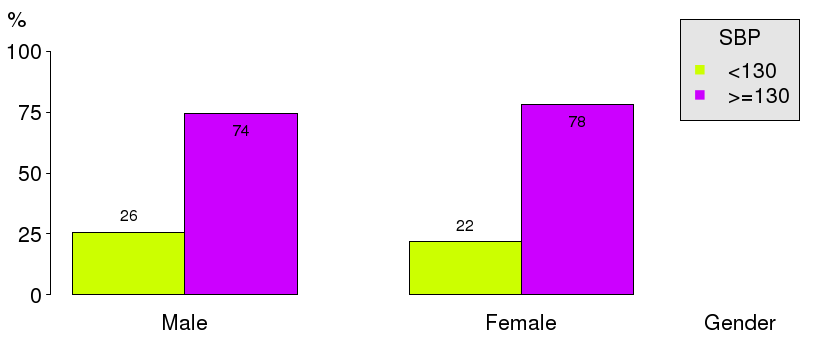
Barplot 2.2.3.1.11 - SBP (by Gender, Type of Diabetes = Type 2)
| SBP |
Gender |
|
| Male (%) |
Female (%) |
|
| <130 |
18081 ( 25.6) |
17327 ( 21.7) |
35408 ( 23.5) |
| >=130 |
52571 ( 74.4) |
62389 ( 78.3) |
114960 ( 76.5) |
|
70652 ( 47.0) |
79716 ( 53.0) |
150368 (100.0) |
Table 2.2.3.1.14 : SBP (by Gender, Type of Diabetes = Type 2)
| CMH Chi-Square |
p.value |
df |
| 309.0917 |
0 |
1 |
|
Barplot 2.2.3.1.12 - SBP (by Gender, Type of Diabetes = Type 2)

|
Barplot 2.2.3.1.12a - SBP (by Data Source, Gender = Male, Type of Diabetes=Type 2)

|
Barplot 2.2.3.1.12b - SBP (by Data Source, Gender = Female, Type of Diabetes=Type 2)
| SBP |
Age |
|
| Valid Value (%) |
NV/NA (%) |
|
| Valid Value |
150368 ( 85.8) |
0 ( 0.0) |
150368 ( 85.8) |
| NV/NA |
24872 ( 14.2) |
0 ( 0.0) |
24872 ( 14.2) |
|
175240 (100.0) |
0 ( 0.0) |
175240 (100.0) |
Table 2.2.3.1.15 : SBP (by Age, Type of Diabetes = Type 2)
| CMH Chi-Square |
p.value |
df |
| 89872.4379 |
0 |
1 |

|
Barplot 2.2.3.1.13 - SBP (by Gender, Type of Diabetes = Type 2)
| SBP |
Age |
|
| <15 (%) |
[15 - 25) (%) |
[25 - 50) (%) |
[50 - 65) (%) |
[65 - 80) (%) |
>=80 (%) |
|
| <130 |
5 ( 45.5) |
61 ( 57.0) |
3971 ( 36.4) |
12375 ( 24.7) |
14593 ( 20.8) |
4403 ( 23.0) |
35408 ( 23.5) |
| >=130 |
6 ( 54.5) |
46 ( 43.0) |
6924 ( 63.6) |
37798 ( 75.3) |
55479 ( 79.2) |
14707 ( 77.0) |
114960 ( 76.5) |
|
11 ( 0.0) |
107 ( 0.1) |
10895 ( 7.2) |
50173 ( 33.4) |
70072 ( 46.6) |
19110 ( 12.7) |
150368 (100.0) |
Table 2.2.3.1.16 : SBP (by Age, Type of Diabetes = Type 2)
| CMH Chi-Square |
p.value |
df |
| 1402.4976 |
0 |
5 |

|
Barplot 2.2.3.1.14 - SBP (by Age, Type of Diabetes = Type 2)

|
Barplot 2.2.3.1.14a - SBP (by Data Source, Age = <15, Type of Diabetes=Type 2)

|
Barplot 2.2.3.1.14b - SBP (by Data Source, Age = [15 - 25), Type of Diabetes=Type 2)

|
Barplot 2.2.3.1.14c - SBP (by Data Source, Age = [25 - 50), Type of Diabetes=Type 2)

|
Barplot 2.2.3.1.14d - SBP (by Data Source, Age = [50 - 65), Type of Diabetes=Type 2)
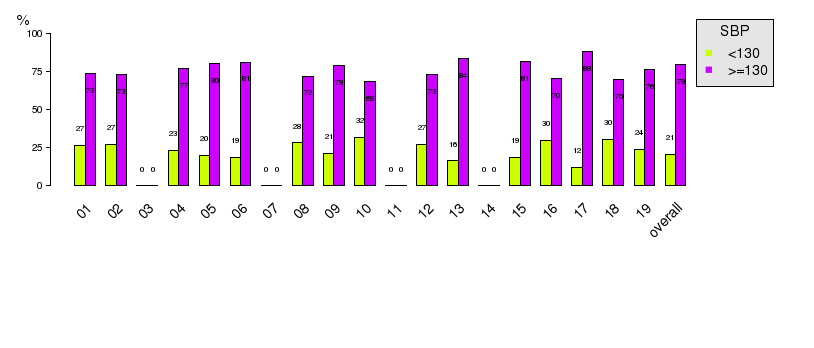
|
Barplot 2.2.3.1.14e - SBP (by Data Source, Age = [65 - 80), Type of Diabetes=Type 2)
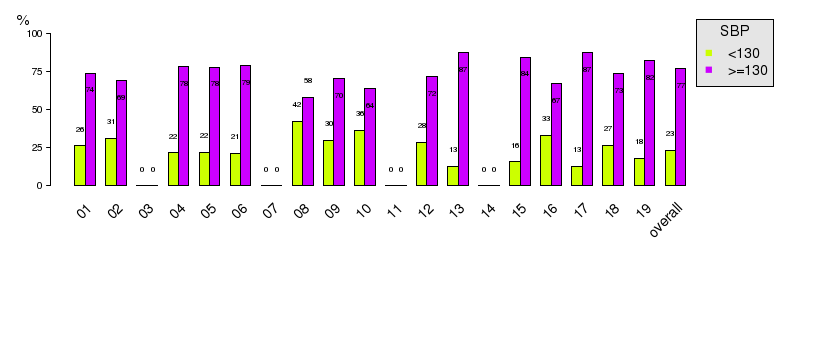
|
Barplot 2.2.3.1.14f - SBP (by Data Source, Age = >=80, Type of Diabetes=Type 2)
| SBP |
Gender * Age |
|
| Valid Value |
NV/NA |
|
Valid Value (%) |
NV/NA (%) |
Valid Value (%) |
NV/NA (%) |
|
| Valid Value |
150368 ( 85.8) |
0 ( 0.0) |
0 ( 0.0) |
0 ( 0.0) |
150368 ( 85.8) |
| NV/NA |
24872 ( 14.2) |
0 ( 0.0) |
0 ( 0.0) |
0 ( 0.0) |
24872 ( 14.2) |
|
175240 (100.0) |
0 ( 0.0) |
0 ( 0.0) |
0 ( 0.0) |
175240 (100.0) |
Table 2.2.3.1.17 : SBP (by Gender * Age, Type of Diabetes = Type 2)
| SBP |
Gender * Age |
|
| <15 |
[15 - 25) |
[25 - 50) |
[50 - 65) |
[65 - 80) |
>=80 |
|
Male (%) |
Female (%) |
Male (%) |
Female (%) |
Male (%) |
Female (%) |
Male (%) |
Female (%) |
Male (%) |
Female (%) |
Male (%) |
Female (%) |
|
| <130 |
1 ( 33.3) |
4 ( 50.0) |
45 ( 69.2) |
16 ( 38.1) |
1784 ( 39.6) |
2187 ( 34.2) |
5729 ( 24.1) |
6646 ( 25.2) |
7210 ( 18.5) |
7383 ( 23.8) |
2558 ( 20.8) |
1845 ( 27.2) |
35408 ( 23.5) |
| >=130 |
2 ( 66.7) |
4 ( 50.0) |
20 ( 30.8) |
26 ( 61.9) |
2722 ( 60.4) |
4202 ( 65.8) |
18038 ( 75.9) |
19760 ( 74.8) |
31849 ( 81.5) |
23630 ( 76.2) |
9758 ( 79.2) |
4949 ( 72.8) |
114960 ( 76.5) |
|
3 ( 0.0) |
8 ( 0.0) |
65 ( 0.0) |
42 ( 0.0) |
4506 ( 3.0) |
6389 ( 4.2) |
23767 ( 15.8) |
26406 ( 17.6) |
39059 ( 26.0) |
31013 ( 20.6) |
12316 ( 8.2) |
6794 ( 4.5) |
150368 (100.0) |
Table 2.2.3.1.18 : SBP (by Gender * Age, Type of Diabetes = Type 2)
| CMH Chi-Square |
p.value |
df |
| 270158.7001 |
0 |
23 |
| SBP |
Gender |
|
| Valid Value (%) |
NV/NA (%) |
|
| Valid Value |
2754 ( 71.2) |
0 ( 0.0) |
2754 ( 71.2) |
| NV/NA |
1116 ( 28.8) |
0 ( 0.0) |
1116 ( 28.8) |
|
3870 (100.0) |
0 ( 0.0) |
3870 (100.0) |
Table 2.2.3.1.19 : SBP (by Gender, Type of Diabetes = Other Type)
| CMH Chi-Square |
p.value |
df |
| 693.293 |
0 |
1 |

|
Barplot 2.2.3.1.15 - SBP (by Gender, Type of Diabetes = Other Type)
| SBP |
Gender |
|
| Male (%) |
Female (%) |
|
| <130 |
444 ( 37.9) |
963 ( 60.9) |
1407 ( 51.1) |
| >=130 |
728 ( 62.1) |
619 ( 39.1) |
1347 ( 48.9) |
|
1172 ( 42.6) |
1582 ( 57.4) |
2754 (100.0) |
Table 2.2.3.1.20 : SBP (by Gender, Type of Diabetes = Other Type)
| CMH Chi-Square |
p.value |
df |
| 141.4625 |
0 |
1 |

|
Barplot 2.2.3.1.16 - SBP (by Gender, Type of Diabetes = Other Type)

|
Barplot 2.2.3.1.16a - SBP (by Data Source, Gender = Male, Type of Diabetes=Other Type)

|
Barplot 2.2.3.1.16b - SBP (by Data Source, Gender = Female, Type of Diabetes=Other Type)
| SBP |
Age |
|
| Valid Value (%) |
NV/NA (%) |
|
| Valid Value |
2754 ( 71.2) |
0 ( 0.0) |
2754 ( 71.2) |
| NV/NA |
1116 ( 28.8) |
0 ( 0.0) |
1116 ( 28.8) |
|
3870 (100.0) |
0 ( 0.0) |
3870 (100.0) |
Table 2.2.3.1.21 : SBP (by Age, Type of Diabetes = Other Type)
| CMH Chi-Square |
p.value |
df |
| 693.293 |
0 |
1 |

|
Barplot 2.2.3.1.17 - SBP (by Gender, Type of Diabetes = Other Type)
| SBP |
Age |
|
| <15 (%) |
[15 - 25) (%) |
[25 - 50) (%) |
[50 - 65) (%) |
[65 - 80) (%) |
>=80 (%) |
|
| <130 |
7 (100.0) |
52 ( 78.8) |
809 ( 77.0) |
312 ( 40.2) |
184 ( 26.2) |
43 ( 28.3) |
1407 ( 51.1) |
| >=130 |
0 ( 0.0) |
14 ( 21.2) |
242 ( 23.0) |
465 ( 59.8) |
517 ( 73.8) |
109 ( 71.7) |
1347 ( 48.9) |
|
7 ( 0.3) |
66 ( 2.4) |
1051 ( 38.2) |
777 ( 28.2) |
701 ( 25.5) |
152 ( 5.5) |
2754 (100.0) |
Table 2.2.3.1.22 : SBP (by Age, Type of Diabetes = Other Type)
| CMH Chi-Square |
p.value |
df |
| 550.6938 |
0 |
5 |

|
Barplot 2.2.3.1.18 - SBP (by Age, Type of Diabetes = Other Type)

|
Barplot 2.2.3.1.18a - SBP (by Data Source, Age = <15, Type of Diabetes=Other Type)

|
Barplot 2.2.3.1.18b - SBP (by Data Source, Age = [15 - 25), Type of Diabetes=Other Type)

|
Barplot 2.2.3.1.18c - SBP (by Data Source, Age = [25 - 50), Type of Diabetes=Other Type)

|
Barplot 2.2.3.1.18d - SBP (by Data Source, Age = [50 - 65), Type of Diabetes=Other Type)

|
Barplot 2.2.3.1.18e - SBP (by Data Source, Age = [65 - 80), Type of Diabetes=Other Type)

|
Barplot 2.2.3.1.18f - SBP (by Data Source, Age = >=80, Type of Diabetes=Other Type)
| SBP |
Gender * Age |
|
| Valid Value |
NV/NA |
|
Valid Value (%) |
NV/NA (%) |
Valid Value (%) |
NV/NA (%) |
|
| Valid Value |
2754 ( 71.2) |
0 ( 0.0) |
0 ( 0.0) |
0 ( 0.0) |
2754 ( 71.2) |
| NV/NA |
1116 ( 28.8) |
0 ( 0.0) |
0 ( 0.0) |
0 ( 0.0) |
1116 ( 28.8) |
|
3870 (100.0) |
0 ( 0.0) |
0 ( 0.0) |
0 ( 0.0) |
3870 (100.0) |
Table 2.2.3.1.23 : SBP (by Gender * Age, Type of Diabetes = Other Type)
| SBP |
Gender * Age |
|
| <15 |
[15 - 25) |
[25 - 50) |
[50 - 65) |
[65 - 80) |
>=80 |
|
Male (%) |
Female (%) |
Male (%) |
Female (%) |
Male (%) |
Female (%) |
Male (%) |
Female (%) |
Male (%) |
Female (%) |
Male (%) |
Female (%) |
|
| <130 |
5 (100.0) |
2 (100.0) |
49 ( 80.3) |
3 ( 60.0) |
672 ( 83.8) |
137 ( 55.0) |
130 ( 42.3) |
182 ( 38.7) |
85 ( 26.6) |
99 ( 26.0) |
22 ( 25.3) |
21 ( 32.3) |
1407 ( 51.1) |
| >=130 |
0 ( 0.0) |
0 ( 0.0) |
12 ( 19.7) |
2 ( 40.0) |
130 ( 16.2) |
112 ( 45.0) |
177 ( 57.7) |
288 ( 61.3) |
235 ( 73.4) |
282 ( 74.0) |
65 ( 74.7) |
44 ( 67.7) |
1347 ( 48.9) |
|
5 ( 0.2) |
2 ( 0.1) |
61 ( 2.2) |
5 ( 0.2) |
802 ( 29.1) |
249 ( 9.0) |
307 ( 11.1) |
470 ( 17.1) |
320 ( 11.6) |
381 ( 13.8) |
87 ( 3.2) |
65 ( 2.4) |
2754 (100.0) |
Table 2.2.3.1.24 : SBP (by Gender * Age, Type of Diabetes = Other Type)
| CMH Chi-Square |
p.value |
df |
| 4440.2658 |
0 |
23 |

|
Trellis Barplot: 2.2.3.1.254 - SBP * Gender * Age (Type of Diabetes = Type 1)

|
Trellis Barplot: 2.2.3.1.255 - SBP * Gender * Age (Type of Diabetes = Type 2)

|
Trellis Barplot: 2.2.3.1.256 - SBP * Gender * Age (Type of Diabetes = Other Type)

|
Boxplot: 2.2.3.1.1 - SBP (by Type of Diabetes)

|
Boxplot: 2.2.3.1.2 - SBP (by Data source, Type of Diabetes = Type 1)

|
Boxplot: 2.2.3.1.3 - SBP (by Data source, Type of Diabetes = Type 2)

|
Boxplot: 2.2.3.1.4 - SBP (by Data source, Type of Diabetes = Other Type)

|
Boxplot: 2.2.3.1.5 - SBP (by Gender)

|
Boxplot: 2.2.3.1.6 - SBP (by Data source, Gender = Male)

|
Boxplot: 2.2.3.1.7 - SBP (by Data source, Gender = Female)

|
Boxplot: 2.2.3.1.8 - SBP (by Age)

|
Boxplot: 2.2.3.1.9 - SBP (by Data source, Age = [15 - 25))

|
Boxplot: 2.2.3.1.10 - SBP (by Data source, Age = [25 - 50))

|
Boxplot: 2.2.3.1.11 - SBP (by Data source, Age = [50 - 65))

|
Boxplot: 2.2.3.1.12 - SBP (by Data source, Age = [65 - 80))

|
Boxplot: 2.2.3.1.13 - SBP (by Data source, Age = >=80)

|
Boxplot: 2.2.3.1.14 - SBP (by Data source, Age = <15)

|
Boxplot: 2.2.3.1.15 - SBP (by Gender, Type of Diabetes = Type 1)

|
Boxplot: 2.2.3.1.16 - SBP (by Data source, Gender = Male, Type of Diabetes = Type 1)

|
Boxplot: 2.2.3.1.17 - SBP (by Data source, Gender = Female, Type of Diabetes = Type 1)

|
Boxplot: 2.2.3.1.18 - SBP (by Age, Type of Diabetes = Type 1)

|
Boxplot: 2.2.3.1.19 - SBP (by Data source, Age = [15 - 25), Type of Diabetes = Type 1)

|
Boxplot: 2.2.3.1.20 - SBP (by Data source, Age = [25 - 50), Type of Diabetes = Type 1)

|
Boxplot: 2.2.3.1.21 - SBP (by Data source, Age = [50 - 65), Type of Diabetes = Type 1)

|
Boxplot: 2.2.3.1.22 - SBP (by Data source, Age = [65 - 80), Type of Diabetes = Type 1)

|
Boxplot: 2.2.3.1.23 - SBP (by Data source, Age = >=80, Type of Diabetes = Type 1)

|
Boxplot: 2.2.3.1.24 - SBP (by Data source, Age = <15, Type of Diabetes = Type 1)

|
Boxplot: 2.2.3.1.25 - SBP (by Gender, Type of Diabetes = Type 2)

|
Boxplot: 2.2.3.1.26 - SBP (by Data source, Gender = Male, Type of Diabetes = Type 2)

|
Boxplot: 2.2.3.1.27 - SBP (by Data source, Gender = Female, Type of Diabetes = Type 2)

|
Boxplot: 2.2.3.1.28 - SBP (by Age, Type of Diabetes = Type 2)

|
Boxplot: 2.2.3.1.29 - SBP (by Data source, Age = [25 - 50), Type of Diabetes = Type 2)

|
Boxplot: 2.2.3.1.30 - SBP (by Data source, Age = [50 - 65), Type of Diabetes = Type 2)

|
Boxplot: 2.2.3.1.31 - SBP (by Data source, Age = [65 - 80), Type of Diabetes = Type 2)

|
Boxplot: 2.2.3.1.32 - SBP (by Data source, Age = >=80, Type of Diabetes = Type 2)

|
Boxplot: 2.2.3.1.33 - SBP (by Data source, Age = [15 - 25), Type of Diabetes = Type 2)

|
Boxplot: 2.2.3.1.34 - SBP (by Data source, Age = <15, Type of Diabetes = Type 2)

|
Boxplot: 2.2.3.1.35 - SBP (by Gender, Type of Diabetes = Other Type)
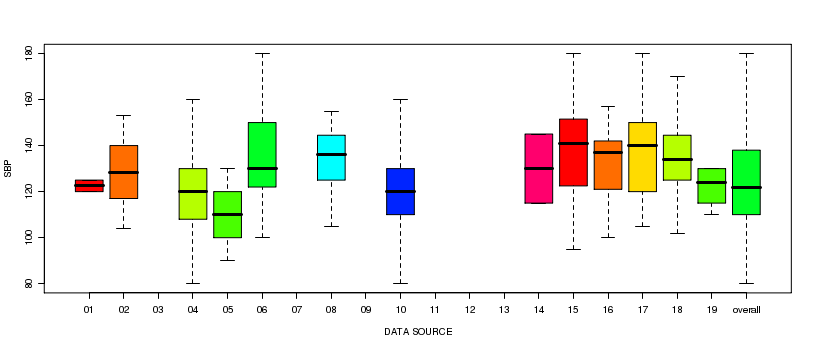
|
Boxplot: 2.2.3.1.36 - SBP (by Data source, Gender = Female, Type of Diabetes = Other Type)

|
Boxplot: 2.2.3.1.37 - SBP (by Data source, Gender = Male, Type of Diabetes = Other Type)

|
Boxplot: 2.2.3.1.38 - SBP (by Age, Type of Diabetes = Other Type)

|
Boxplot: 2.2.3.1.39 - SBP (by Data source, Age = [25 - 50), Type of Diabetes = Other Type)
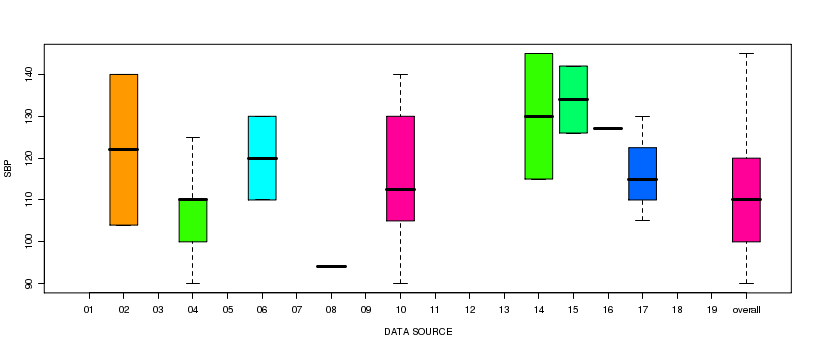
|
Boxplot: 2.2.3.1.40 - SBP (by Data source, Age = [15 - 25), Type of Diabetes = Other Type)

|
Boxplot: 2.2.3.1.41 - SBP (by Data source, Age = [50 - 65), Type of Diabetes = Other Type)

|
Boxplot: 2.2.3.1.42 - SBP (by Data source, Age = [65 - 80), Type of Diabetes = Other Type)

|
Boxplot: 2.2.3.1.43 - SBP (by Data source, Age = <15, Type of Diabetes = Other Type)

|
Boxplot: 2.2.3.1.44 - SBP (by Data source, Age = >=80, Type of Diabetes = Other Type)
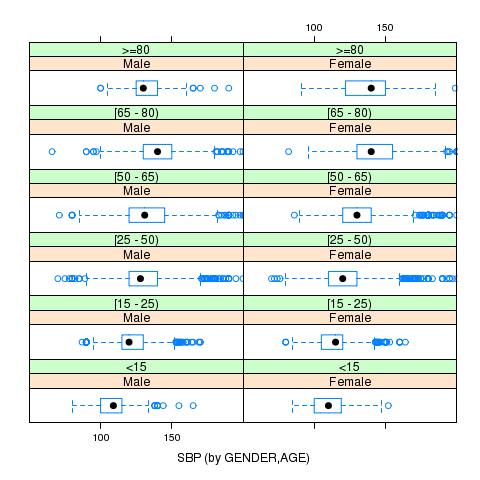
|
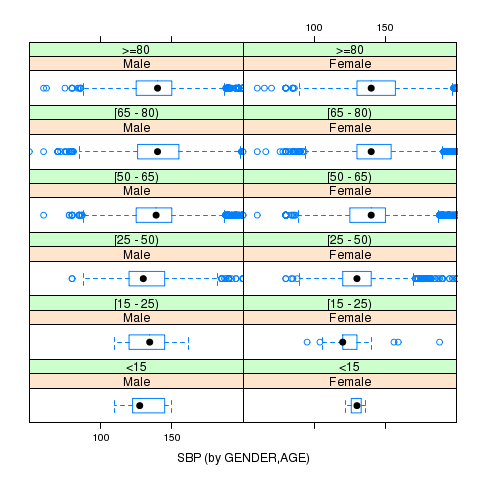
Trellis Boxplot: 2.2.3.1.45 - SBP * Gender * Age (Type of Diabetes = Type 1)
|
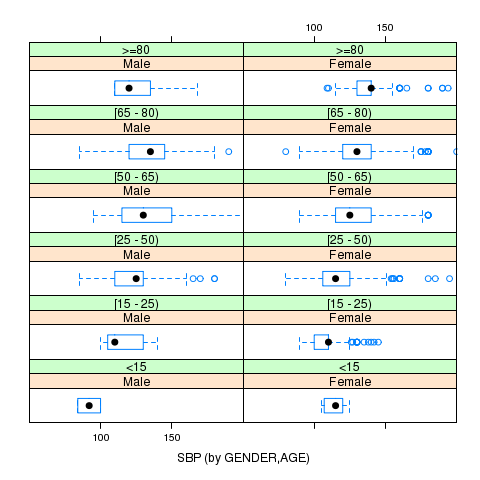
Trellis Boxplot: 2.2.3.1.46 - SBP * Gender * Age (Type of Diabetes = Type 2)
|
Trellis Boxplot: 2.2.3.1.47 - SBP * Gender * Age (Type of Diabetes = Other Type)
