| Smoke |
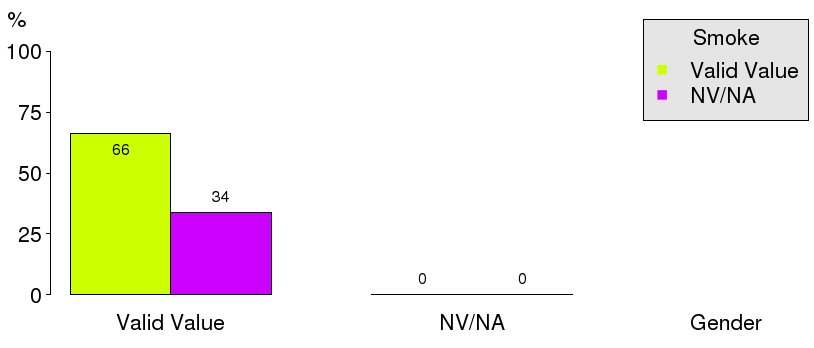
Valid Value (%) |
NV/NA (%) |
|
| Valid Value |
91823 ( 66.4) |
0 ( 0.0) |
91823 ( 66.4) |
| NV/NA |
46535 ( 33.6) |
0 ( 0.0) |
46535 ( 33.6) |
|
138358 (100.0) |
0 ( 0.0) |
138358 (100.0) |
Table 2.2.2.1.1 : Smoke (by Type of Diabetes)
| CMH Chi-Square |
p.value |
df |
| 14823.884 |
0 |
1 |

|
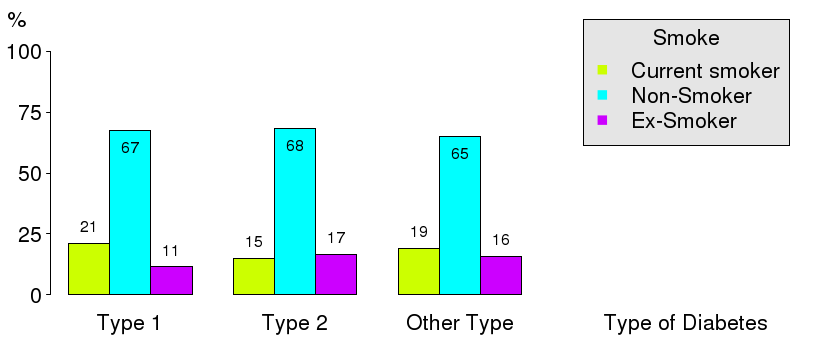
Barplot 2.2.2.1.1 - Smoke (by Type of Diabetes)
| Smoke |
Type 1 (%) |
Type 2 (%) |
Other Type (%) |
|
| Current smoker |
2353 ( 21.2) |
11963 ( 15.1) |
315 ( 19.2) |
14631 ( 15.9) |
| Non-Smoker |
7454 ( 67.3) |
53979 ( 68.2) |
1064 ( 64.9) |
62497 ( 68.1) |
| Ex-Smoker |
1272 ( 11.5) |
13162 ( 16.6) |
261 ( 15.9) |
14695 ( 16.0) |
|
11079 ( 12.1) |
79104 ( 86.1) |
1640 ( 1.8) |
91823 (100.0) |
Table 2.2.2.1.2 : Smoke (by Type of Diabetes)
| CMH Chi-Square |
p.value |
df |
| 404.6448 |
0 |
4 |
|
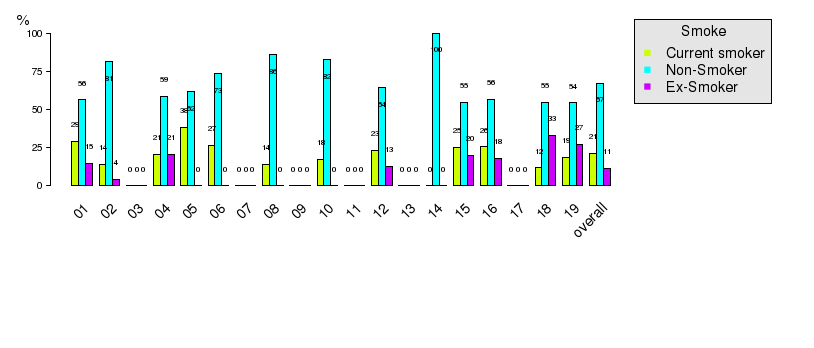
Barplot 2.2.2.1.2 - Smoke (by Type of Diabetes)
|
Barplot 2.2.2.1.2a - Smoke (by Data Source, Type of Diabetes = Type 1)
|
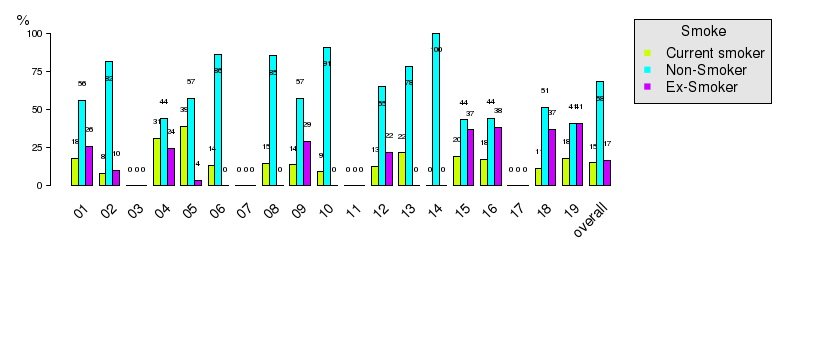
Barplot 2.2.2.1.2b - Smoke (by Data Source, Type of Diabetes = Type 2)

|
Barplot 2.2.2.1.2c - Smoke (by Data Source, Type of Diabetes = Other Type)
| Smoke |
Valid Value (%) |
NV/NA (%) |
|
| Valid Value |
91823 ( 66.4) |
0 ( 0.0) |
91823 ( 66.4) |
| NV/NA |
46535 ( 33.6) |
0 ( 0.0) |
46535 ( 33.6) |
|
138358 (100.0) |
0 ( 0.0) |
138358 (100.0) |
Table 2.2.2.1.3 : Smoke (by Gender)
| CMH Chi-Square |
p.value |
df |
| 14823.884 |
0 |
1 |
|
Barplot 2.2.2.1.3 - Smoke (by Gender)
| Smoke |
Male (%) |
Female (%) |
|
| Current smoker |
8934 ( 18.3) |
5697 ( 13.2) |
14631 ( 15.9) |
| Non-Smoker |
29643 ( 60.9) |
32854 ( 76.2) |
62497 ( 68.1) |
| Ex-Smoker |
10111 ( 20.8) |
4584 ( 10.6) |
14695 ( 16.0) |
|
48688 ( 53.0) |
43135 ( 47.0) |
91823 (100.0) |
Table 2.2.2.1.4 : Smoke (by Gender)
| CMH Chi-Square |
p.value |
df |
| 2633.7366 |
0 |
2 |

|
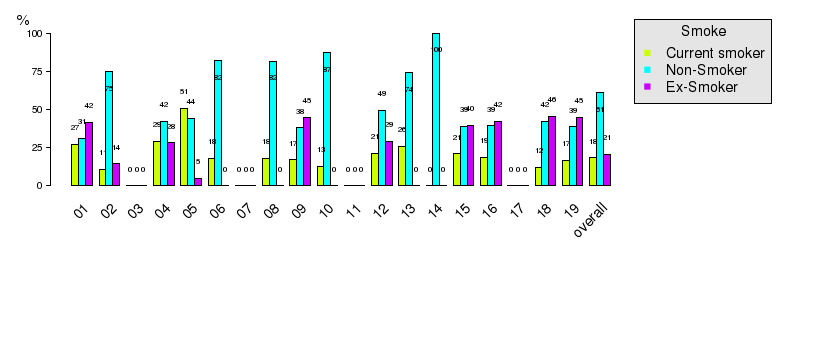
Barplot 2.2.2.1.4 - Smoke (by Gender)
|
Barplot 2.2.2.1.4a - Smoke (by Data Source, Gender = Male)

|
Barplot 2.2.2.1.4b - Smoke (by Data Source, Gender = Female)
| Smoke |
Valid Value (%) |
NV/NA (%) |
|
| Valid Value |
91823 ( 66.4) |
0 ( 0.0) |
91823 ( 66.4) |
| NV/NA |
46535 ( 33.6) |
0 ( 0.0) |
46535 ( 33.6) |
|
138358 (100.0) |
0 ( 0.0) |
138358 (100.0) |
Table 2.2.2.1.5 : Smoke (by Age)
| CMH Chi-Square |
p.value |
df |
| 14823.884 |
0 |
1 |

|
Barplot 2.2.2.1.5 - Smoke (by Age)
| Smoke |
<15 (%) |
[15 - 25) (%) |
[25 - 50) (%) |
[50 - 65) (%) |
[65 - 80) (%) |
>=80 (%) |
|
| Current smoker |
1 ( 0.2) |
274 ( 18.7) |
3444 ( 28.0) |
6623 ( 21.6) |
3831 ( 10.4) |
458 ( 4.5) |
14631 ( 15.9) |
| Non-Smoker |
477 ( 99.8) |
1136 ( 77.7) |
7581 ( 61.7) |
19188 ( 62.7) |
26275 ( 71.5) |
7840 ( 76.7) |
62497 ( 68.1) |
| Ex-Smoker |
0 ( 0.0) |
52 ( 3.6) |
1269 ( 10.3) |
4797 ( 15.7) |
6647 ( 18.1) |
1930 ( 18.9) |
14695 ( 16.0) |
|
478 ( 0.5) |
1462 ( 1.6) |
12294 ( 13.4) |
30608 ( 33.3) |
36753 ( 40.0) |
10228 ( 11.1) |
91823 (100.0) |
Table 2.2.2.1.6 : Smoke (by Age)
| CMH Chi-Square |
p.value |
df |
| 4464.0158 |
0 |
10 |

|
Barplot 2.2.2.1.6 - Smoke (by Age)

|
Barplot 2.2.2.1.6a - Smoke (by Data Source, Age = <15)

|
Barplot 2.2.2.1.6b - Smoke (by Data Source, Age = [15 - 25))

|
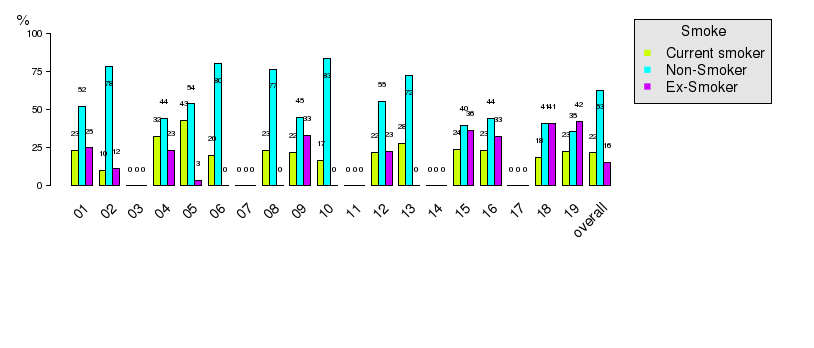
Barplot 2.2.2.1.6c - Smoke (by Data Source, Age = [25 - 50))
|
Barplot 2.2.2.1.6d - Smoke (by Data Source, Age = [50 - 65))

|
Barplot 2.2.2.1.6e - Smoke (by Data Source, Age = [65 - 80))

|
Barplot 2.2.2.1.6f - Smoke (by Data Source, Age = >=80)
| Smoke |
Gender |
|
| Valid Value (%) |
NV/NA (%) |
|
| Valid Value |
11079 ( 67.3) |
0 ( 0.0) |
11079 ( 67.3) |
| NV/NA |
5382 ( 32.7) |
0 ( 0.0) |
5382 ( 32.7) |
|
16461 (100.0) |
0 ( 0.0) |
16461 (100.0) |
Table 2.2.2.1.7 : Smoke (by Gender, Type of Diabetes = Type 1)
| CMH Chi-Square |
p.value |
df |
| 1971.6791 |
0 |
1 |
|
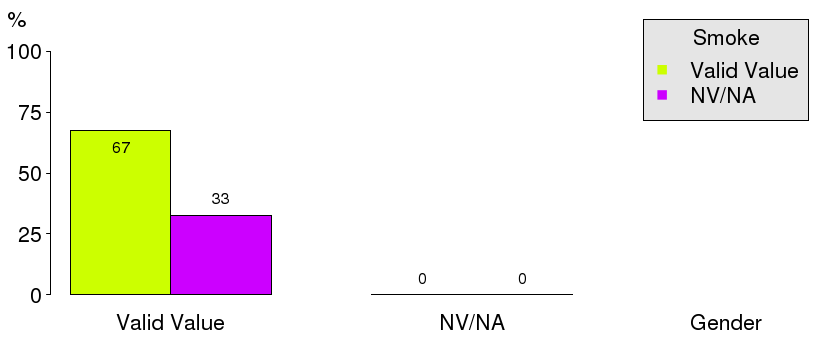
Barplot 2.2.2.1.7 - Smoke (by Gender, Type of Diabetes = Type 1)
| Smoke |
Gender |
|
| Male (%) |
Female (%) |
|
| Current smoker |
1442 ( 23.5) |
911 ( 18.5) |
2353 ( 21.2) |
| Non-Smoker |
3874 ( 63.1) |
3580 ( 72.5) |
7454 ( 67.3) |
| Ex-Smoker |
828 ( 13.5) |
444 ( 9.0) |
1272 ( 11.5) |
|
6144 ( 55.5) |
4935 ( 44.5) |
11079 (100.0) |
Table 2.2.2.1.8 : Smoke (by Gender, Type of Diabetes = Type 1)
| CMH Chi-Square |
p.value |
df |
| 116.8093 |
0 |
2 |

|
Barplot 2.2.2.1.8 - Smoke (by Gender, Type of Diabetes = Type 1)

|
Barplot 2.2.2.1.8a - Smoke (by Data Source, Gender = Male, Type of Diabetes=Type 1)

|
Barplot 2.2.2.1.8b - Smoke (by Data Source, Gender = Female, Type of Diabetes=Type 1)
| Smoke |
Age |
|
| Valid Value (%) |
NV/NA (%) |
|
| Valid Value |
11079 ( 67.3) |
0 ( 0.0) |
11079 ( 67.3) |
| NV/NA |
5382 ( 32.7) |
0 ( 0.0) |
5382 ( 32.7) |
|
16461 (100.0) |
0 ( 0.0) |
16461 (100.0) |
Table 2.2.2.1.9 : Smoke (by Age, Type of Diabetes = Type 1)
| CMH Chi-Square |
p.value |
df |
| 1971.6791 |
0 |
1 |

|
Barplot 2.2.2.1.9 - Smoke (by Gender, Type of Diabetes = Type 1)
| Smoke |
Age |
|
| <15 (%) |
[15 - 25) (%) |
[25 - 50) (%) |
[50 - 65) (%) |
[65 - 80) (%) |
>=80 (%) |
|
| Current smoker |
0 ( 0.0) |
246 ( 18.2) |
1377 ( 26.5) |
618 ( 22.4) |
108 ( 9.6) |
4 ( 2.2) |
2353 ( 21.2) |
| Non-Smoker |
464 (100.0) |
1060 ( 78.2) |
3258 ( 62.7) |
1702 ( 61.8) |
819 ( 72.9) |
151 ( 81.2) |
7454 ( 67.3) |
| Ex-Smoker |
0 ( 0.0) |
49 ( 3.6) |
562 ( 10.8) |
434 ( 15.8) |
196 ( 17.5) |
31 ( 16.7) |
1272 ( 11.5) |
|
464 ( 4.2) |
1355 ( 12.2) |
5197 ( 46.9) |
2754 ( 24.9) |
1123 ( 10.1) |
186 ( 1.7) |
11079 (100.0) |
Table 2.2.2.1.10 : Smoke (by Age, Type of Diabetes = Type 1)
| CMH Chi-Square |
p.value |
df |
| 626.0821 |
0 |
10 |

|
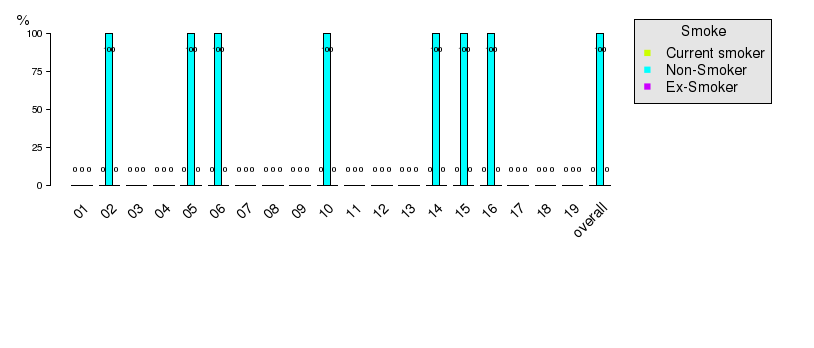
Barplot 2.2.2.1.10 - Smoke (by Age, Type of Diabetes = Type 1)
|
Barplot 2.2.2.1.10a - Smoke (by Data Source, Age = <15, Type of Diabetes=Type 1)

|
Barplot 2.2.2.1.10b - Smoke (by Data Source, Age = [15 - 25), Type of Diabetes=Type 1)

|
Barplot 2.2.2.1.10c - Smoke (by Data Source, Age = [25 - 50), Type of Diabetes=Type 1)

|
Barplot 2.2.2.1.10d - Smoke (by Data Source, Age = [50 - 65), Type of Diabetes=Type 1)

|
Barplot 2.2.2.1.10e - Smoke (by Data Source, Age = [65 - 80), Type of Diabetes=Type 1)

|
Barplot 2.2.2.1.10f - Smoke (by Data Source, Age = >=80, Type of Diabetes=Type 1)
| Smoke |
Gender * Age |
|
| Valid Value |
NV/NA |
|
Valid Value (%) |
NV/NA (%) |
Valid Value (%) |
NV/NA (%) |
|
| Valid Value |
11079 ( 67.3) |
0 ( 0.0) |
0 ( 0.0) |
0 ( 0.0) |
11079 ( 67.3) |
| NV/NA |
5382 ( 32.7) |
0 ( 0.0) |
0 ( 0.0) |
0 ( 0.0) |
5382 ( 32.7) |
|
16461 (100.0) |
0 ( 0.0) |
0 ( 0.0) |
0 ( 0.0) |
16461 (100.0) |
Table 2.2.2.1.11 : Smoke (by Gender * Age, Type of Diabetes = Type 1)
| Smoke |
Gender * Age |
|
| <15 |
[15 - 25) |
[25 - 50) |
[50 - 65) |
[65 - 80) |
>=80 |
|
Male (%) |
Female (%) |
Male (%) |
Female (%) |
Male (%) |
Female (%) |
Male (%) |
Female (%) |
Male (%) |
Female (%) |
Male (%) |
Female (%) |
|
| Current smoker |
0 ( 0.0) |
0 ( 0.0) |
104 ( 17.4) |
142 ( 18.8) |
524 ( 23.4) |
853 ( 28.8) |
239 ( 20.1) |
379 ( 24.2) |
43 ( 7.5) |
65 ( 11.9) |
1 ( 0.9) |
3 ( 3.9) |
2353 ( 21.2) |
| Non-Smoker |
225 (100.0) |
239 (100.0) |
468 ( 78.3) |
592 ( 78.2) |
1501 ( 67.1) |
1757 ( 59.4) |
811 ( 68.1) |
891 ( 57.0) |
477 ( 83.0) |
342 ( 62.4) |
98 ( 89.9) |
53 ( 68.8) |
7454 ( 67.3) |
| Ex-Smoker |
0 ( 0.0) |
0 ( 0.0) |
26 ( 4.3) |
23 ( 3.0) |
212 ( 9.5) |
350 ( 11.8) |
141 ( 11.8) |
293 ( 18.7) |
55 ( 9.6) |
141 ( 25.7) |
10 ( 9.2) |
21 ( 27.3) |
1272 ( 11.5) |
|
225 ( 2.0) |
239 ( 2.2) |
598 ( 5.4) |
757 ( 6.8) |
2237 ( 20.2) |
2960 ( 26.7) |
1191 ( 10.8) |
1563 ( 14.1) |
575 ( 5.2) |
548 ( 4.9) |
109 ( 1.0) |
77 ( 0.7) |
11079 (100.0) |
Table 2.2.2.1.12 : Smoke (by Gender * Age, Type of Diabetes = Type 1)
| CMH Chi-Square |
p.value |
df |
| 19347.0894 |
0 |
35 |
| Smoke |
Gender |
|
| Valid Value (%) |
NV/NA (%) |
|
| Valid Value |
79104 ( 66.5) |
0 ( 0.0) |
79104 ( 66.5) |
| NV/NA |
39787 ( 33.5) |
0 ( 0.0) |
39787 ( 33.5) |
|
118891 (100.0) |
0 ( 0.0) |
118891 (100.0) |
Table 2.2.2.1.13 : Smoke (by Gender, Type of Diabetes = Type 2)
| CMH Chi-Square |
p.value |
df |
| 13002.048 |
0 |
1 |

|
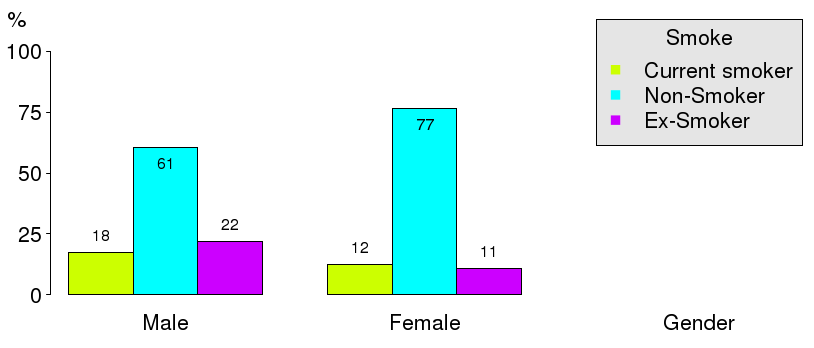
Barplot 2.2.2.1.11 - Smoke (by Gender, Type of Diabetes = Type 2)
| Smoke |
Gender |
|
| Male (%) |
Female (%) |
|
| Current smoker |
7306 ( 17.5) |
4657 ( 12.5) |
11963 ( 15.1) |
| Non-Smoker |
25328 ( 60.7) |
28651 ( 76.7) |
53979 ( 68.2) |
| Ex-Smoker |
9103 ( 21.8) |
4059 ( 10.9) |
13162 ( 16.6) |
|
41737 ( 52.8) |
37367 ( 47.2) |
79104 (100.0) |
Table 2.2.2.1.14 : Smoke (by Gender, Type of Diabetes = Type 2)
| CMH Chi-Square |
p.value |
df |
| 2490.3115 |
0 |
2 |
|
Barplot 2.2.2.1.12 - Smoke (by Gender, Type of Diabetes = Type 2)

|
Barplot 2.2.2.1.12a - Smoke (by Data Source, Gender = Male, Type of Diabetes=Type 2)

|
Barplot 2.2.2.1.12b - Smoke (by Data Source, Gender = Female, Type of Diabetes=Type 2)
| Smoke |
Age |
|
| Valid Value (%) |
NV/NA (%) |
|
| Valid Value |
79104 ( 66.5) |
0 ( 0.0) |
79104 ( 66.5) |
| NV/NA |
39787 ( 33.5) |
0 ( 0.0) |
39787 ( 33.5) |
|
118891 (100.0) |
0 ( 0.0) |
118891 (100.0) |
Table 2.2.2.1.15 : Smoke (by Age, Type of Diabetes = Type 2)
| CMH Chi-Square |
p.value |
df |
| 13002.048 |
0 |
1 |

|
Barplot 2.2.2.1.13 - Smoke (by Gender, Type of Diabetes = Type 2)
| Smoke |
Age |
|
| <15 (%) |
[15 - 25) (%) |
[25 - 50) (%) |
[50 - 65) (%) |
[65 - 80) (%) |
>=80 (%) |
|
| Current smoker |
1 ( 11.1) |
22 ( 33.3) |
1951 ( 29.3) |
5881 ( 21.5) |
3662 ( 10.4) |
446 ( 4.5) |
11963 ( 15.1) |
| Non-Smoker |
8 ( 88.9) |
41 ( 62.1) |
4032 ( 60.5) |
17196 ( 62.9) |
25119 ( 71.5) |
7583 ( 76.6) |
53979 ( 68.2) |
| Ex-Smoker |
0 ( 0.0) |
3 ( 4.5) |
686 ( 10.3) |
4260 ( 15.6) |
6342 ( 18.1) |
1871 ( 18.9) |
13162 ( 16.6) |
|
9 ( 0.0) |
66 ( 0.1) |
6669 ( 8.4) |
27337 ( 34.6) |
35123 ( 44.4) |
9900 ( 12.5) |
79104 (100.0) |
Table 2.2.2.1.16 : Smoke (by Age, Type of Diabetes = Type 2)
| CMH Chi-Square |
p.value |
df |
| 3474.6024 |
0 |
10 |

|
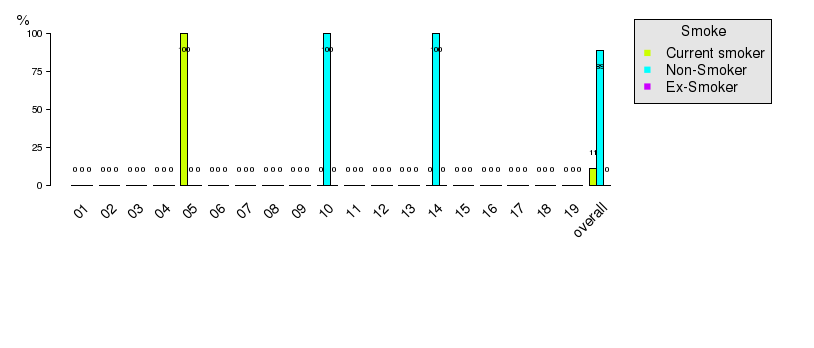
Barplot 2.2.2.1.14 - Smoke (by Age, Type of Diabetes = Type 2)
|
Barplot 2.2.2.1.14a - Smoke (by Data Source, Age = <15, Type of Diabetes=Type 2)

|
Barplot 2.2.2.1.14b - Smoke (by Data Source, Age = [15 - 25), Type of Diabetes=Type 2)

|
Barplot 2.2.2.1.14c - Smoke (by Data Source, Age = [25 - 50), Type of Diabetes=Type 2)

|
Barplot 2.2.2.1.14d - Smoke (by Data Source, Age = [50 - 65), Type of Diabetes=Type 2)

|
Barplot 2.2.2.1.14e - Smoke (by Data Source, Age = [65 - 80), Type of Diabetes=Type 2)

|
Barplot 2.2.2.1.14f - Smoke (by Data Source, Age = >=80, Type of Diabetes=Type 2)
| Smoke |
Gender * Age |
|
| Valid Value |
NV/NA |
|
Valid Value (%) |
NV/NA (%) |
Valid Value (%) |
NV/NA (%) |
|
| Valid Value |
79104 ( 66.5) |
0 ( 0.0) |
0 ( 0.0) |
0 ( 0.0) |
79104 ( 66.5) |
| NV/NA |
39787 ( 33.5) |
0 ( 0.0) |
0 ( 0.0) |
0 ( 0.0) |
39787 ( 33.5) |
|
118891 (100.0) |
0 ( 0.0) |
0 ( 0.0) |
0 ( 0.0) |
118891 (100.0) |
Table 2.2.2.1.17 : Smoke (by Gender * Age, Type of Diabetes = Type 2)
| Smoke |
Gender * Age |
|
| <15 |
[15 - 25) |
[25 - 50) |
[50 - 65) |
[65 - 80) |
>=80 |
|
Male (%) |
Female (%) |
Male (%) |
Female (%) |
Male (%) |
Female (%) |
Male (%) |
Female (%) |
Male (%) |
Female (%) |
Male (%) |
Female (%) |
|
| Current smoker |
0 ( 0.0) |
1 ( 20.0) |
16 ( 37.2) |
6 ( 26.1) |
683 ( 25.6) |
1268 ( 31.7) |
2202 ( 19.4) |
3679 ( 23.0) |
1543 ( 8.9) |
2119 ( 11.9) |
213 ( 3.6) |
233 ( 5.8) |
11963 ( 15.1) |
| Non-Smoker |
4 (100.0) |
4 ( 80.0) |
26 ( 60.5) |
15 ( 65.2) |
1767 ( 66.3) |
2265 ( 56.6) |
7914 ( 69.7) |
9282 ( 58.1) |
13879 ( 79.8) |
11240 ( 63.4) |
5061 ( 85.6) |
2522 ( 63.2) |
53979 ( 68.2) |
| Ex-Smoker |
0 ( 0.0) |
0 ( 0.0) |
1 ( 2.3) |
2 ( 8.7) |
217 ( 8.1) |
469 ( 11.7) |
1243 ( 10.9) |
3017 ( 18.9) |
1963 ( 11.3) |
4379 ( 24.7) |
635 ( 10.7) |
1236 ( 31.0) |
13162 ( 16.6) |
|
4 ( 0.0) |
5 ( 0.0) |
43 ( 0.1) |
23 ( 0.0) |
2667 ( 3.4) |
4002 ( 5.1) |
11359 ( 14.4) |
15978 ( 20.2) |
17385 ( 22.0) |
17738 ( 22.4) |
5909 ( 7.5) |
3991 ( 5.0) |
79104 (100.0) |
Table 2.2.2.1.18 : Smoke (by Gender * Age, Type of Diabetes = Type 2)
| CMH Chi-Square |
p.value |
df |
| 180884.8908 |
0 |
35 |
| Smoke |
Gender |
|
| Valid Value (%) |
NV/NA (%) |
|
| Valid Value |
1640 ( 54.6) |
0 ( 0.0) |
1640 ( 54.6) |
| NV/NA |
1366 ( 45.4) |
0 ( 0.0) |
1366 ( 45.4) |
|
3006 (100.0) |
0 ( 0.0) |
3006 (100.0) |
Table 2.2.2.1.19 : Smoke (by Gender, Type of Diabetes = Other Type)
| CMH Chi-Square |
p.value |
df |
| 24.9754 |
0 |
1 |

|
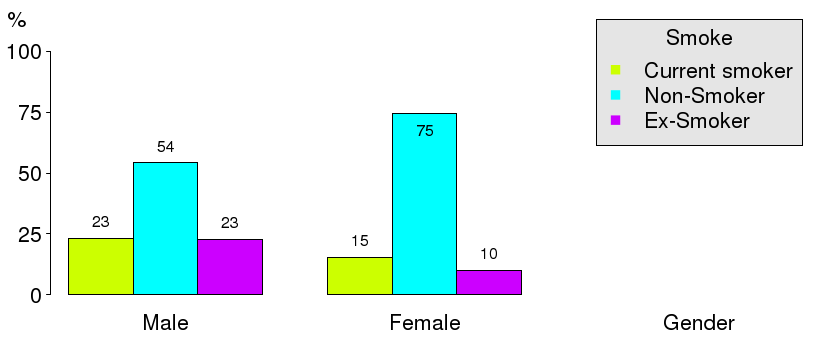
Barplot 2.2.2.1.15 - Smoke (by Gender, Type of Diabetes = Other Type)
| Smoke |
Gender |
|
| Male (%) |
Female (%) |
|
| Current smoker |
186 ( 23.0) |
129 ( 15.5) |
315 ( 19.2) |
| Non-Smoker |
441 ( 54.6) |
623 ( 74.8) |
1064 ( 64.9) |
| Ex-Smoker |
180 ( 22.3) |
81 ( 9.7) |
261 ( 15.9) |
|
807 ( 49.2) |
833 ( 50.8) |
1640 (100.0) |
Table 2.2.2.1.20 : Smoke (by Gender, Type of Diabetes = Other Type)
| CMH Chi-Square |
p.value |
df |
| 78.6052 |
0 |
2 |
|
Barplot 2.2.2.1.16 - Smoke (by Gender, Type of Diabetes = Other Type)

|
Barplot 2.2.2.1.16a - Smoke (by Data Source, Gender = Male, Type of Diabetes=Other Type)
|
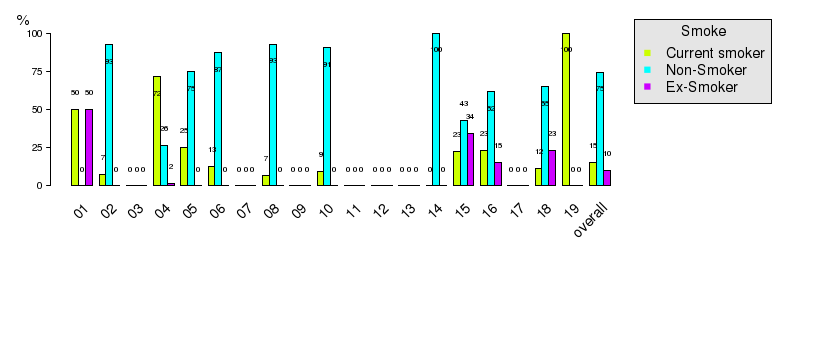
Barplot 2.2.2.1.16b - Smoke (by Data Source, Gender = Female, Type of Diabetes=Other Type)
| Smoke |
Age |
|
| Valid Value (%) |
NV/NA (%) |
|
| Valid Value |
1640 ( 54.6) |
0 ( 0.0) |
1640 ( 54.6) |
| NV/NA |
1366 ( 45.4) |
0 ( 0.0) |
1366 ( 45.4) |
|
3006 (100.0) |
0 ( 0.0) |
3006 (100.0) |
Table 2.2.2.1.21 : Smoke (by Age, Type of Diabetes = Other Type)
| CMH Chi-Square |
p.value |
df |
| 24.9754 |
0 |
1 |

|
Barplot 2.2.2.1.17 - Smoke (by Gender, Type of Diabetes = Other Type)
| Smoke |
Age |
|
| <15 (%) |
[15 - 25) (%) |
[25 - 50) (%) |
[50 - 65) (%) |
[65 - 80) (%) |
>=80 (%) |
|
| Current smoker |
0 ( 0.0) |
6 ( 14.6) |
116 ( 27.1) |
124 ( 24.0) |
61 ( 12.0) |
8 ( 5.6) |
315 ( 19.2) |
| Non-Smoker |
5 (100.0) |
35 ( 85.4) |
291 ( 68.0) |
290 ( 56.1) |
337 ( 66.5) |
106 ( 74.6) |
1064 ( 64.9) |
| Ex-Smoker |
0 ( 0.0) |
0 ( 0.0) |
21 ( 4.9) |
103 ( 19.9) |
109 ( 21.5) |
28 ( 19.7) |
261 ( 15.9) |
|
5 ( 0.3) |
41 ( 2.5) |
428 ( 26.1) |
517 ( 31.5) |
507 ( 30.9) |
142 ( 8.7) |
1640 (100.0) |
Table 2.2.2.1.22 : Smoke (by Age, Type of Diabetes = Other Type)
| CMH Chi-Square |
p.value |
df |
| 117.6873 |
0 |
10 |

|
Barplot 2.2.2.1.18 - Smoke (by Age, Type of Diabetes = Other Type)

|
Barplot 2.2.2.1.18a - Smoke (by Data Source, Age = <15, Type of Diabetes=Other Type)

|
Barplot 2.2.2.1.18b - Smoke (by Data Source, Age = [15 - 25), Type of Diabetes=Other Type)

|
Barplot 2.2.2.1.18c - Smoke (by Data Source, Age = [25 - 50), Type of Diabetes=Other Type)

|
Barplot 2.2.2.1.18d - Smoke (by Data Source, Age = [50 - 65), Type of Diabetes=Other Type)

|
Barplot 2.2.2.1.18e - Smoke (by Data Source, Age = [65 - 80), Type of Diabetes=Other Type)

|
Barplot 2.2.2.1.18f - Smoke (by Data Source, Age = >=80, Type of Diabetes=Other Type)
| Smoke |
Gender * Age |
|
| Valid Value |
NV/NA |
|
Valid Value (%) |
NV/NA (%) |
Valid Value (%) |
NV/NA (%) |
|
| Valid Value |
1640 ( 54.6) |
0 ( 0.0) |
0 ( 0.0) |
0 ( 0.0) |
1640 ( 54.6) |
| NV/NA |
1366 ( 45.4) |
0 ( 0.0) |
0 ( 0.0) |
0 ( 0.0) |
1366 ( 45.4) |
|
3006 (100.0) |
0 ( 0.0) |
0 ( 0.0) |
0 ( 0.0) |
3006 (100.0) |
Table 2.2.2.1.23 : Smoke (by Gender * Age, Type of Diabetes = Other Type)
| Smoke |
Gender * Age |
|
| <15 |
[15 - 25) |
[25 - 50) |
[50 - 65) |
[65 - 80) |
>=80 |
|
Male (%) |
Female (%) |
Male (%) |
Female (%) |
Male (%) |
Female (%) |
Male (%) |
Female (%) |
Male (%) |
Female (%) |
Male (%) |
Female (%) |
|
| Current smoker |
0 ( 0.0) |
0 ( 0.0) |
6 ( 17.1) |
0 ( 0.0) |
65 ( 21.7) |
51 ( 39.5) |
38 ( 19.3) |
86 ( 26.9) |
18 ( 8.1) |
43 ( 15.1) |
2 ( 2.6) |
6 ( 9.1) |
315 ( 19.2) |
| Non-Smoker |
3 (100.0) |
2 (100.0) |
29 ( 82.9) |
6 (100.0) |
225 ( 75.3) |
66 ( 51.2) |
126 ( 64.0) |
164 ( 51.2) |
173 ( 77.6) |
164 ( 57.7) |
67 ( 88.2) |
39 ( 59.1) |
1064 ( 64.9) |
| Ex-Smoker |
0 ( 0.0) |
0 ( 0.0) |
0 ( 0.0) |
0 ( 0.0) |
9 ( 3.0) |
12 ( 9.3) |
33 ( 16.8) |
70 ( 21.9) |
32 ( 14.3) |
77 ( 27.1) |
7 ( 9.2) |
21 ( 31.8) |
261 ( 15.9) |
|
3 ( 0.2) |
2 ( 0.1) |
35 ( 2.1) |
6 ( 0.4) |
299 ( 18.2) |
129 ( 7.9) |
197 ( 12.0) |
320 ( 19.5) |
223 ( 13.6) |
284 ( 17.3) |
76 ( 4.6) |
66 ( 4.0) |
1640 (100.0) |
Table 2.2.2.1.24 : Smoke (by Gender * Age, Type of Diabetes = Other Type)
| CMH Chi-Square |
p.value |
df |
| 2597.6829 |
0 |
35 |
