| BMI |
Valid Value (%) |
NV/NA (%) |
|
| Valid Value |
140778 ( 85.3) |
0 ( 0.0) |
140778 ( 85.3) |
| NV/NA |
24225 ( 14.7) |
0 ( 0.0) |
24225 ( 14.7) |
|
165003 (100.0) |
0 ( 0.0) |
165003 (100.0) |
Table 2.2.1.2.1 : BMI (by Type of Diabetes)
| CMH Chi-Square |
p.value |
df |
| 82329.4232 |
0 |
1 |

|
Barplot 2.2.1.2.1 - BMI (by Type of Diabetes)
| BMI |
Type 1 (%) |
Type 2 (%) |
Other Type (%) |
|
| <18.5 |
622 ( 4.4) |
372 ( 0.3) |
36 ( 1.6) |
1030 ( 0.7) |
| [18.5 - 25) |
6671 ( 46.7) |
14680 ( 11.8) |
597 ( 26.4) |
21948 ( 15.6) |
| [25 - 30) |
4825 ( 33.8) |
42893 ( 34.5) |
862 ( 38.1) |
48580 ( 34.5) |
| >=30 |
2164 ( 15.2) |
66286 ( 53.4) |
770 ( 34.0) |
69220 ( 49.2) |
|
14282 ( 10.1) |
124231 ( 88.2) |
2265 ( 1.6) |
140778 (100.0) |
Table 2.2.1.2.2 : BMI (by Type of Diabetes)
| CMH Chi-Square |
p.value |
df |
| 16997.9046 |
0 |
6 |

|
Barplot 2.2.1.2.2 - BMI (by Type of Diabetes)

|
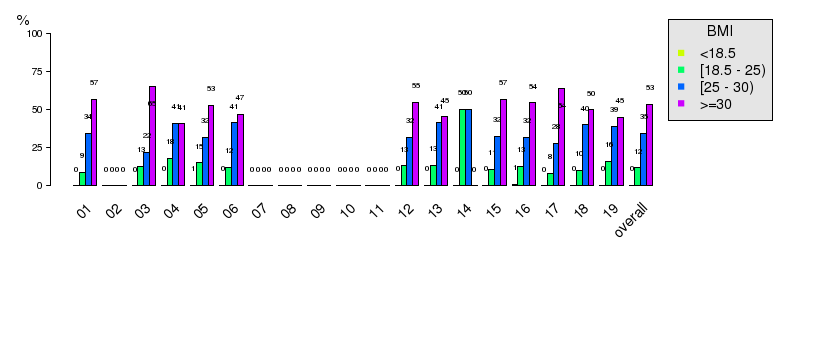
Barplot 2.2.1.2.2a - BMI (by Data Source, Type of Diabetes = Type 1)
|
Barplot 2.2.1.2.2b - BMI (by Data Source, Type of Diabetes = Type 2)

|
Barplot 2.2.1.2.2c - BMI (by Data Source, Type of Diabetes = Other Type)
| BMI |
Valid Value (%) |
NV/NA (%) |
|
| Valid Value |
140778 ( 85.3) |
0 ( 0.0) |
140778 ( 85.3) |
| NV/NA |
24225 ( 14.7) |
0 ( 0.0) |
24225 ( 14.7) |
|
165003 (100.0) |
0 ( 0.0) |
165003 (100.0) |
Table 2.2.1.2.3 : BMI (by Gender)
| CMH Chi-Square |
p.value |
df |
| 82329.4232 |
0 |
1 |

|
Barplot 2.2.1.2.3 - BMI (by Gender)
| BMI |
Male (%) |
Female (%) |
|
| <18.5 |
487 ( 0.7) |
543 ( 0.7) |
1030 ( 0.7) |
| [18.5 - 25) |
11081 ( 16.5) |
10867 ( 14.8) |
21948 ( 15.6) |
| [25 - 30) |
26958 ( 40.1) |
21622 ( 29.4) |
48580 ( 34.5) |
| >=30 |
28767 ( 42.7) |
40453 ( 55.0) |
69220 ( 49.2) |
|
67293 ( 47.8) |
73485 ( 52.2) |
140778 (100.0) |
Table 2.2.1.2.4 : BMI (by Gender)
| CMH Chi-Square |
p.value |
df |
| 2296.2046 |
0 |
3 |

|
Barplot 2.2.1.2.4 - BMI (by Gender)

|
Barplot 2.2.1.2.4a - BMI (by Data Source, Gender = Male)

|
Barplot 2.2.1.2.4b - BMI (by Data Source, Gender = Female)
| BMI |
Valid Value (%) |
NV/NA (%) |
|
| Valid Value |
140778 ( 85.3) |
0 ( 0.0) |
140778 ( 85.3) |
| NV/NA |
24225 ( 14.7) |
0 ( 0.0) |
24225 ( 14.7) |
|
165003 (100.0) |
0 ( 0.0) |
165003 (100.0) |
Table 2.2.1.2.5 : BMI (by Age)
| CMH Chi-Square |
p.value |
df |
| 82329.4232 |
0 |
1 |

|
Barplot 2.2.1.2.5 - BMI (by Age)
| BMI |
<15 (%) |
[15 - 25) (%) |
[25 - 50) (%) |
[50 - 65) (%) |
[65 - 80) (%) |
>=80 (%) |
|
| <18.5 |
398 ( 55.3) |
79 ( 3.9) |
150 ( 0.9) |
136 ( 0.3) |
151 ( 0.3) |
116 ( 0.8) |
1030 ( 0.7) |
| [18.5 - 25) |
282 ( 39.2) |
1298 ( 64.5) |
4488 ( 26.7) |
5366 ( 11.4) |
7325 ( 12.3) |
3189 ( 21.5) |
21948 ( 15.6) |
| [25 - 30) |
35 ( 4.9) |
468 ( 23.2) |
5126 ( 30.5) |
15085 ( 32.2) |
21743 ( 36.5) |
6123 ( 41.3) |
48580 ( 34.5) |
| >=30 |
5 ( 0.7) |
168 ( 8.3) |
7042 ( 41.9) |
26327 ( 56.1) |
30286 ( 50.9) |
5392 ( 36.4) |
69220 ( 49.2) |
|
720 ( 0.5) |
2013 ( 1.4) |
16806 ( 11.9) |
46914 ( 33.3) |
59505 ( 42.3) |
14820 ( 10.5) |
140778 (100.0) |
Table 2.2.1.2.6 : BMI (by Age)
| CMH Chi-Square |
p.value |
df |
| 38692.5668 |
0 |
15 |

|
Barplot 2.2.1.2.6 - BMI (by Age)

|
Barplot 2.2.1.2.6a - BMI (by Data Source, Age = <15)

|
Barplot 2.2.1.2.6b - BMI (by Data Source, Age = [15 - 25))

|
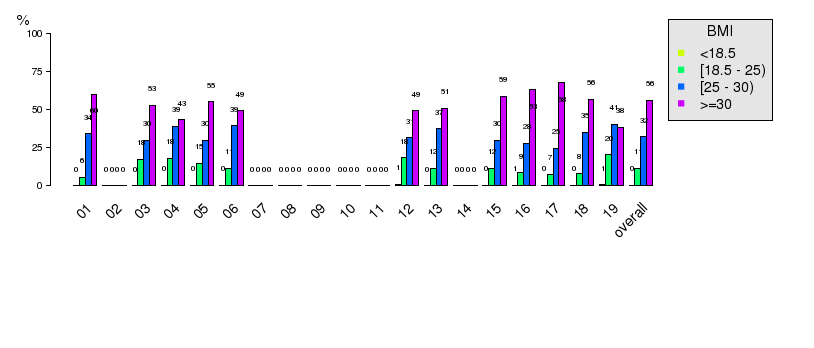
Barplot 2.2.1.2.6c - BMI (by Data Source, Age = [25 - 50))
|
Barplot 2.2.1.2.6d - BMI (by Data Source, Age = [50 - 65))

|
Barplot 2.2.1.2.6e - BMI (by Data Source, Age = [65 - 80))

|
Barplot 2.2.1.2.6f - BMI (by Data Source, Age = >=80)
| BMI |
Gender |
|
| Valid Value (%) |
NV/NA (%) |
|
| Valid Value |
14282 ( 83.9) |
0 ( 0.0) |
14282 ( 83.9) |
| NV/NA |
2742 ( 16.1) |
0 ( 0.0) |
2742 ( 16.1) |
|
17024 (100.0) |
0 ( 0.0) |
17024 (100.0) |
Table 2.2.1.2.7 : BMI (by Gender, Type of Diabetes = Type 1)
| CMH Chi-Square |
p.value |
df |
| 7822.5799 |
0 |
1 |

|
Barplot 2.2.1.2.7 - BMI (by Gender, Type of Diabetes = Type 1)
| BMI |
Gender |
|
| Male (%) |
Female (%) |
|
| <18.5 |
319 ( 4.1) |
303 ( 4.7) |
622 ( 4.4) |
| [18.5 - 25) |
3435 ( 44.2) |
3236 ( 49.7) |
6671 ( 46.7) |
| [25 - 30) |
2957 ( 38.0) |
1868 ( 28.7) |
4825 ( 33.8) |
| >=30 |
1066 ( 13.7) |
1098 ( 16.9) |
2164 ( 15.2) |
|
7777 ( 54.5) |
6505 ( 45.5) |
14282 (100.0) |
Table 2.2.1.2.8 : BMI (by Gender, Type of Diabetes = Type 1)
| CMH Chi-Square |
p.value |
df |
| 140.4334 |
0 |
3 |

|
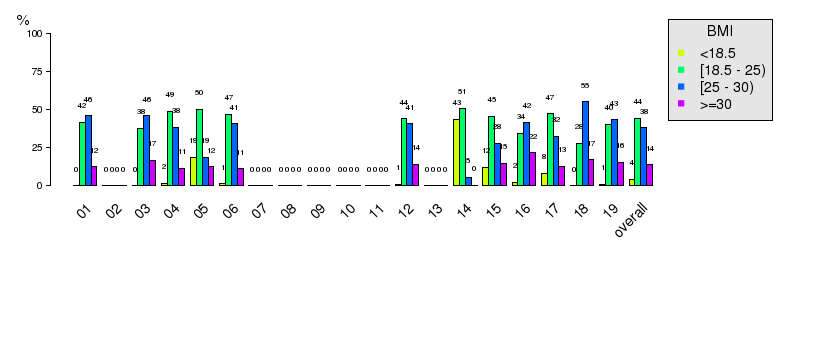
Barplot 2.2.1.2.8 - BMI (by Gender, Type of Diabetes = Type 1)
|
Barplot 2.2.1.2.8a - BMI (by Data Source, Gender = Male, Type of Diabetes=Type 1)

|
Barplot 2.2.1.2.8b - BMI (by Data Source, Gender = Female, Type of Diabetes=Type 1)
| BMI |
Age |
|
| Valid Value (%) |
NV/NA (%) |
|
| Valid Value |
14282 ( 83.9) |
0 ( 0.0) |
14282 ( 83.9) |
| NV/NA |
2742 ( 16.1) |
0 ( 0.0) |
2742 ( 16.1) |
|
17024 (100.0) |
0 ( 0.0) |
17024 (100.0) |
Table 2.2.1.2.9 : BMI (by Age, Type of Diabetes = Type 1)
| CMH Chi-Square |
p.value |
df |
| 7822.5799 |
0 |
1 |

|
Barplot 2.2.1.2.9 - BMI (by Gender, Type of Diabetes = Type 1)
| BMI |
Age |
|
| <15 (%) |
[15 - 25) (%) |
[25 - 50) (%) |
[50 - 65) (%) |
[65 - 80) (%) |
>=80 (%) |
|
| <18.5 |
388 ( 56.2) |
72 ( 3.8) |
103 ( 1.5) |
44 ( 1.3) |
11 ( 0.9) |
4 ( 2.3) |
622 ( 4.4) |
| [18.5 - 25) |
269 ( 38.9) |
1264 ( 67.2) |
3377 ( 48.5) |
1220 ( 37.2) |
454 ( 35.1) |
87 ( 50.3) |
6671 ( 46.7) |
| [25 - 30) |
31 ( 4.5) |
439 ( 23.3) |
2429 ( 34.9) |
1362 ( 41.5) |
511 ( 39.6) |
53 ( 30.6) |
4825 ( 33.8) |
| >=30 |
3 ( 0.4) |
107 ( 5.7) |
1057 ( 15.2) |
652 ( 19.9) |
316 ( 24.5) |
29 ( 16.8) |
2164 ( 15.2) |
|
691 ( 4.8) |
1882 ( 13.2) |
6966 ( 48.8) |
3278 ( 23.0) |
1292 ( 9.0) |
173 ( 1.2) |
14282 (100.0) |
Table 2.2.1.2.10 : BMI (by Age, Type of Diabetes = Type 1)
| CMH Chi-Square |
p.value |
df |
| 5422.8931 |
0 |
15 |

|
Barplot 2.2.1.2.10 - BMI (by Age, Type of Diabetes = Type 1)

|
Barplot 2.2.1.2.10a - BMI (by Data Source, Age = <15, Type of Diabetes=Type 1)

|
Barplot 2.2.1.2.10b - BMI (by Data Source, Age = [15 - 25), Type of Diabetes=Type 1)

|
Barplot 2.2.1.2.10c - BMI (by Data Source, Age = [25 - 50), Type of Diabetes=Type 1)

|
Barplot 2.2.1.2.10d - BMI (by Data Source, Age = [50 - 65), Type of Diabetes=Type 1)

|
Barplot 2.2.1.2.10e - BMI (by Data Source, Age = [65 - 80), Type of Diabetes=Type 1)

|
Barplot 2.2.1.2.10f - BMI (by Data Source, Age = >=80, Type of Diabetes=Type 1)
| BMI |
Gender * Age |
|
| Valid Value |
NV/NA |
|
Valid Value (%) |
NV/NA (%) |
Valid Value (%) |
NV/NA (%) |
|
| Valid Value |
14282 ( 83.9) |
0 ( 0.0) |
0 ( 0.0) |
0 ( 0.0) |
14282 ( 83.9) |
| NV/NA |
2742 ( 16.1) |
0 ( 0.0) |
0 ( 0.0) |
0 ( 0.0) |
2742 ( 16.1) |
|
17024 (100.0) |
0 ( 0.0) |
0 ( 0.0) |
0 ( 0.0) |
17024 (100.0) |
Table 2.2.1.2.11 : BMI (by Gender * Age, Type of Diabetes = Type 1)
| BMI |
Gender * Age |
|
| <15 |
[15 - 25) |
[25 - 50) |
[50 - 65) |
[65 - 80) |
>=80 |
|
Male (%) |
Female (%) |
Male (%) |
Female (%) |
Male (%) |
Female (%) |
Male (%) |
Female (%) |
Male (%) |
Female (%) |
Male (%) |
Female (%) |
|
| <18.5 |
170 ( 50.6) |
218 ( 61.4) |
29 ( 3.5) |
43 ( 4.1) |
66 ( 2.1) |
37 ( 1.0) |
27 ( 1.9) |
17 ( 0.9) |
8 ( 1.1) |
3 ( 0.5) |
3 ( 2.9) |
1 ( 1.4) |
622 ( 4.4) |
| [18.5 - 25) |
148 ( 44.0) |
121 ( 34.1) |
549 ( 65.6) |
715 ( 68.4) |
1636 ( 53.2) |
1741 ( 44.8) |
602 ( 41.3) |
618 ( 33.9) |
247 ( 35.5) |
207 ( 34.7) |
54 ( 52.4) |
33 ( 47.1) |
6671 ( 46.7) |
| [25 - 30) |
15 ( 4.5) |
16 ( 4.5) |
201 ( 24.0) |
238 ( 22.8) |
883 ( 28.7) |
1546 ( 39.8) |
507 ( 34.8) |
855 ( 46.9) |
236 ( 33.9) |
275 ( 46.1) |
26 ( 25.2) |
27 ( 38.6) |
4825 ( 33.8) |
| >=30 |
3 ( 0.9) |
0 ( 0.0) |
58 ( 6.9) |
49 ( 4.7) |
492 ( 16.0) |
565 ( 14.5) |
320 ( 22.0) |
332 ( 18.2) |
205 ( 29.5) |
111 ( 18.6) |
20 ( 19.4) |
9 ( 12.9) |
2164 ( 15.2) |
|
336 ( 2.4) |
355 ( 2.5) |
837 ( 5.9) |
1045 ( 7.3) |
3077 ( 21.5) |
3889 ( 27.2) |
1456 ( 10.2) |
1822 ( 12.8) |
696 ( 4.9) |
596 ( 4.2) |
103 ( 0.7) |
70 ( 0.5) |
14282 (100.0) |
Table 2.2.1.2.12 : BMI (by Gender * Age, Type of Diabetes = Type 1)
| CMH Chi-Square |
p.value |
df |
| 28459.9936 |
0 |
47 |
| BMI |
Gender |
|
| Valid Value (%) |
NV/NA (%) |
|
| Valid Value |
124231 ( 85.7) |
0 ( 0.0) |
124231 ( 85.7) |
| NV/NA |
20706 ( 14.3) |
0 ( 0.0) |
20706 ( 14.3) |
|
144937 (100.0) |
0 ( 0.0) |
144937 (100.0) |
Table 2.2.1.2.13 : BMI (by Gender, Type of Diabetes = Type 2)
| CMH Chi-Square |
p.value |
df |
| 73945.4082 |
0 |
1 |

|
Barplot 2.2.1.2.11 - BMI (by Gender, Type of Diabetes = Type 2)
| BMI |
Gender |
|
| Male (%) |
Female (%) |
|
| <18.5 |
149 ( 0.3) |
223 ( 0.3) |
372 ( 0.3) |
| [18.5 - 25) |
7337 ( 12.6) |
7343 ( 11.2) |
14680 ( 11.8) |
| [25 - 30) |
23538 ( 40.3) |
19355 ( 29.4) |
42893 ( 34.5) |
| >=30 |
27382 ( 46.9) |
38904 ( 59.1) |
66286 ( 53.4) |
|
58406 ( 47.0) |
65825 ( 53.0) |
124231 (100.0) |
Table 2.2.1.2.14 : BMI (by Gender, Type of Diabetes = Type 2)
| CMH Chi-Square |
p.value |
df |
| 1989.4766 |
0 |
3 |
|
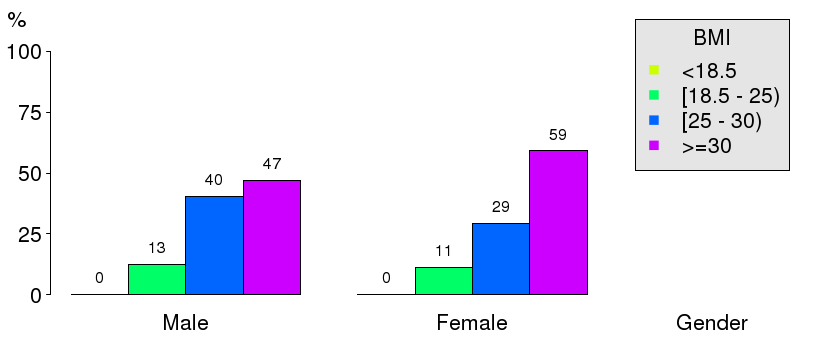
Barplot 2.2.1.2.12 - BMI (by Gender, Type of Diabetes = Type 2)

|
Barplot 2.2.1.2.12a - BMI (by Data Source, Gender = Male, Type of Diabetes=Type 2)

|
Barplot 2.2.1.2.12b - BMI (by Data Source, Gender = Female, Type of Diabetes=Type 2)
| BMI |
Age |
|
| Valid Value (%) |
NV/NA (%) |
|
| Valid Value |
124231 ( 85.7) |
0 ( 0.0) |
124231 ( 85.7) |
| NV/NA |
20706 ( 14.3) |
0 ( 0.0) |
20706 ( 14.3) |
|
144937 (100.0) |
0 ( 0.0) |
144937 (100.0) |
Table 2.2.1.2.15 : BMI (by Age, Type of Diabetes = Type 2)
| CMH Chi-Square |
p.value |
df |
| 73945.4082 |
0 |
1 |

|
Barplot 2.2.1.2.13 - BMI (by Gender, Type of Diabetes = Type 2)
| BMI |
Age |
|
| <15 (%) |
[15 - 25) (%) |
[25 - 50) (%) |
[50 - 65) (%) |
[65 - 80) (%) |
>=80 (%) |
|
| <18.5 |
1 ( 14.3) |
3 ( 3.2) |
38 ( 0.4) |
84 ( 0.2) |
135 ( 0.2) |
111 ( 0.8) |
372 ( 0.3) |
| [18.5 - 25) |
2 ( 28.6) |
19 ( 20.2) |
896 ( 9.8) |
3964 ( 9.2) |
6738 ( 11.7) |
3061 ( 21.1) |
14680 ( 11.8) |
| [25 - 30) |
2 ( 28.6) |
18 ( 19.1) |
2454 ( 26.8) |
13452 ( 31.3) |
20957 ( 36.4) |
6010 ( 41.4) |
42893 ( 34.5) |
| >=30 |
2 ( 28.6) |
54 ( 57.4) |
5753 ( 62.9) |
25413 ( 59.2) |
29738 ( 51.7) |
5326 ( 36.7) |
66286 ( 53.4) |
|
7 ( 0.0) |
94 ( 0.1) |
9141 ( 7.4) |
42913 ( 34.5) |
57568 ( 46.3) |
14508 ( 11.7) |
124231 (100.0) |
Table 2.2.1.2.16 : BMI (by Age, Type of Diabetes = Type 2)
| CMH Chi-Square |
p.value |
df |
| 3309.8069 |
0 |
15 |

|
Barplot 2.2.1.2.14 - BMI (by Age, Type of Diabetes = Type 2)

|
Barplot 2.2.1.2.14a - BMI (by Data Source, Age = <15, Type of Diabetes=Type 2)

|
Barplot 2.2.1.2.14b - BMI (by Data Source, Age = [15 - 25), Type of Diabetes=Type 2)

|
Barplot 2.2.1.2.14c - BMI (by Data Source, Age = [25 - 50), Type of Diabetes=Type 2)

|
Barplot 2.2.1.2.14d - BMI (by Data Source, Age = [50 - 65), Type of Diabetes=Type 2)

|
Barplot 2.2.1.2.14e - BMI (by Data Source, Age = [65 - 80), Type of Diabetes=Type 2)

|
Barplot 2.2.1.2.14f - BMI (by Data Source, Age = >=80, Type of Diabetes=Type 2)
| BMI |
Gender * Age |
|
| Valid Value |
NV/NA |
|
Valid Value (%) |
NV/NA (%) |
Valid Value (%) |
NV/NA (%) |
|
| Valid Value |
124231 ( 85.7) |
0 ( 0.0) |
0 ( 0.0) |
0 ( 0.0) |
124231 ( 85.7) |
| NV/NA |
20706 ( 14.3) |
0 ( 0.0) |
0 ( 0.0) |
0 ( 0.0) |
20706 ( 14.3) |
|
144937 (100.0) |
0 ( 0.0) |
0 ( 0.0) |
0 ( 0.0) |
144937 (100.0) |
Table 2.2.1.2.17 : BMI (by Gender * Age, Type of Diabetes = Type 2)
| BMI |
Gender * Age |
|
| <15 |
[15 - 25) |
[25 - 50) |
[50 - 65) |
[65 - 80) |
>=80 |
|
Male (%) |
Female (%) |
Male (%) |
Female (%) |
Male (%) |
Female (%) |
Male (%) |
Female (%) |
Male (%) |
Female (%) |
Male (%) |
Female (%) |
|
| <18.5 |
0 ( 0.0) |
1 ( 20.0) |
2 ( 4.1) |
1 ( 2.2) |
19 ( 0.5) |
19 ( 0.3) |
39 ( 0.2) |
45 ( 0.2) |
82 ( 0.3) |
53 ( 0.2) |
81 ( 0.9) |
30 ( 0.6) |
372 ( 0.3) |
| [18.5 - 25) |
1 ( 50.0) |
1 ( 20.0) |
11 ( 22.4) |
8 ( 17.8) |
352 ( 9.6) |
544 ( 9.9) |
1711 ( 8.4) |
2253 ( 10.0) |
3438 ( 10.6) |
3300 ( 13.2) |
1830 ( 19.7) |
1231 ( 23.6) |
14680 ( 11.8) |
| [25 - 30) |
1 ( 50.0) |
1 ( 20.0) |
9 ( 18.4) |
9 ( 20.0) |
775 ( 21.1) |
1679 ( 30.7) |
5081 ( 25.0) |
8371 ( 37.1) |
9991 ( 30.8) |
10966 ( 43.7) |
3498 ( 37.7) |
2512 ( 48.1) |
42893 ( 34.5) |
| >=30 |
0 ( 0.0) |
2 ( 40.0) |
27 ( 55.1) |
27 ( 60.0) |
2520 ( 68.7) |
3233 ( 59.1) |
13513 ( 66.4) |
11900 ( 52.7) |
18967 ( 58.4) |
10771 ( 42.9) |
3877 ( 41.8) |
1449 ( 27.7) |
66286 ( 53.4) |
|
2 ( 0.0) |
5 ( 0.0) |
49 ( 0.0) |
45 ( 0.0) |
3666 ( 3.0) |
5475 ( 4.4) |
20344 ( 16.4) |
22569 ( 18.2) |
32478 ( 26.1) |
25090 ( 20.2) |
9286 ( 7.5) |
5222 ( 4.2) |
124231 (100.0) |
Table 2.2.1.2.18 : BMI (by Gender * Age, Type of Diabetes = Type 2)
| CMH Chi-Square |
p.value |
df |
| 342456.7389 |
0 |
47 |
| BMI |
Gender |
|
| Valid Value (%) |
NV/NA (%) |
|
| Valid Value |
2265 ( 74.5) |
0 ( 0.0) |
2265 ( 74.5) |
| NV/NA |
777 ( 25.5) |
0 ( 0.0) |
777 ( 25.5) |
|
3042 (100.0) |
0 ( 0.0) |
3042 (100.0) |
Table 2.2.1.2.19 : BMI (by Gender, Type of Diabetes = Other Type)
| CMH Chi-Square |
p.value |
df |
| 727.858 |
0 |
1 |

|
Barplot 2.2.1.2.15 - BMI (by Gender, Type of Diabetes = Other Type)
| BMI |
Gender |
|
| Male (%) |
Female (%) |
|
| <18.5 |
19 ( 1.7) |
17 ( 1.5) |
36 ( 1.6) |
| [18.5 - 25) |
309 ( 27.8) |
288 ( 24.9) |
597 ( 26.4) |
| [25 - 30) |
463 ( 41.7) |
399 ( 34.5) |
862 ( 38.1) |
| >=30 |
319 ( 28.7) |
451 ( 39.0) |
770 ( 34.0) |
|
1110 ( 49.0) |
1155 ( 51.0) |
2265 (100.0) |
Table 2.2.1.2.20 : BMI (by Gender, Type of Diabetes = Other Type)
| CMH Chi-Square |
p.value |
df |
| 27.3469 |
0 |
3 |

|
Barplot 2.2.1.2.16 - BMI (by Gender, Type of Diabetes = Other Type)

|
Barplot 2.2.1.2.16a - BMI (by Data Source, Gender = Male, Type of Diabetes=Other Type)

|
Barplot 2.2.1.2.16b - BMI (by Data Source, Gender = Female, Type of Diabetes=Other Type)
| BMI |
Age |
|
| Valid Value (%) |
NV/NA (%) |
|
| Valid Value |
2265 ( 74.5) |
0 ( 0.0) |
2265 ( 74.5) |
| NV/NA |
777 ( 25.5) |
0 ( 0.0) |
777 ( 25.5) |
|
3042 (100.0) |
0 ( 0.0) |
3042 (100.0) |
Table 2.2.1.2.21 : BMI (by Age, Type of Diabetes = Other Type)
| CMH Chi-Square |
p.value |
df |
| 727.858 |
0 |
1 |

|
Barplot 2.2.1.2.17 - BMI (by Gender, Type of Diabetes = Other Type)
| BMI |
Age |
|
| <15 (%) |
[15 - 25) (%) |
[25 - 50) (%) |
[50 - 65) (%) |
[65 - 80) (%) |
>=80 (%) |
|
| <18.5 |
9 ( 40.9) |
4 ( 10.8) |
9 ( 1.3) |
8 ( 1.1) |
5 ( 0.8) |
1 ( 0.7) |
36 ( 1.6) |
| [18.5 - 25) |
11 ( 50.0) |
15 ( 40.5) |
215 ( 30.8) |
182 ( 25.2) |
133 ( 20.6) |
41 ( 29.5) |
597 ( 26.4) |
| [25 - 30) |
2 ( 9.1) |
11 ( 29.7) |
243 ( 34.8) |
271 ( 37.5) |
275 ( 42.6) |
60 ( 43.2) |
862 ( 38.1) |
| >=30 |
0 ( 0.0) |
7 ( 18.9) |
232 ( 33.2) |
262 ( 36.2) |
232 ( 36.0) |
37 ( 26.6) |
770 ( 34.0) |
|
22 ( 1.0) |
37 ( 1.6) |
699 ( 30.9) |
723 ( 31.9) |
645 ( 28.5) |
139 ( 6.1) |
2265 (100.0) |
Table 2.2.1.2.22 : BMI (by Age, Type of Diabetes = Other Type)
| CMH Chi-Square |
p.value |
df |
| 286.3959 |
0 |
15 |

|
Barplot 2.2.1.2.18 - BMI (by Age, Type of Diabetes = Other Type)
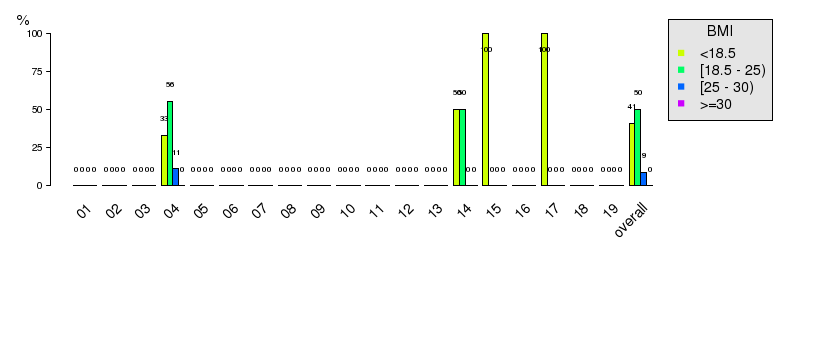
|
Barplot 2.2.1.2.18a - BMI (by Data Source, Age = <15, Type of Diabetes=Other Type)
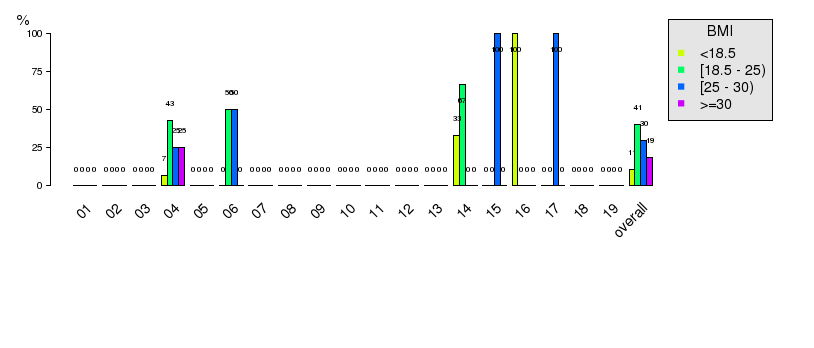
|
Barplot 2.2.1.2.18b - BMI (by Data Source, Age = [15 - 25), Type of Diabetes=Other Type)

|
Barplot 2.2.1.2.18c - BMI (by Data Source, Age = [25 - 50), Type of Diabetes=Other Type)

|
Barplot 2.2.1.2.18d - BMI (by Data Source, Age = [50 - 65), Type of Diabetes=Other Type)

|
Barplot 2.2.1.2.18e - BMI (by Data Source, Age = [65 - 80), Type of Diabetes=Other Type)

|
Barplot 2.2.1.2.18f - BMI (by Data Source, Age = >=80, Type of Diabetes=Other Type)
| BMI |
Gender * Age |
|
| Valid Value |
NV/NA |
|
Valid Value (%) |
NV/NA (%) |
Valid Value (%) |
NV/NA (%) |
|
| Valid Value |
2265 ( 74.5) |
0 ( 0.0) |
0 ( 0.0) |
0 ( 0.0) |
2265 ( 74.5) |
| NV/NA |
777 ( 25.5) |
0 ( 0.0) |
0 ( 0.0) |
0 ( 0.0) |
777 ( 25.5) |
|
3042 (100.0) |
0 ( 0.0) |
0 ( 0.0) |
0 ( 0.0) |
3042 (100.0) |
Table 2.2.1.2.23 : BMI (by Gender * Age, Type of Diabetes = Other Type)
| BMI |
Gender * Age |
|
| <15 |
[15 - 25) |
[25 - 50) |
[50 - 65) |
[65 - 80) |
>=80 |
|
Male (%) |
Female (%) |
Male (%) |
Female (%) |
Male (%) |
Female (%) |
Male (%) |
Female (%) |
Male (%) |
Female (%) |
Male (%) |
Female (%) |
|
| <18.5 |
3 ( 37.5) |
6 ( 42.9) |
4 ( 12.5) |
0 ( 0.0) |
3 ( 0.6) |
6 ( 2.6) |
3 ( 1.1) |
5 ( 1.1) |
3 ( 1.0) |
2 ( 0.6) |
1 ( 1.3) |
0 ( 0.0) |
36 ( 1.6) |
| [18.5 - 25) |
5 ( 62.5) |
6 ( 42.9) |
11 ( 34.4) |
4 ( 80.0) |
136 ( 29.2) |
79 ( 33.8) |
65 ( 23.0) |
117 ( 26.5) |
48 ( 16.6) |
85 ( 23.9) |
23 ( 29.1) |
18 ( 30.0) |
597 ( 26.4) |
| [25 - 30) |
0 ( 0.0) |
2 ( 14.3) |
10 ( 31.2) |
1 ( 20.0) |
154 ( 33.1) |
89 ( 38.0) |
90 ( 31.9) |
181 ( 41.0) |
115 ( 39.8) |
160 ( 44.9) |
30 ( 38.0) |
30 ( 50.0) |
862 ( 38.1) |
| >=30 |
0 ( 0.0) |
0 ( 0.0) |
7 ( 21.9) |
0 ( 0.0) |
172 ( 37.0) |
60 ( 25.6) |
124 ( 44.0) |
138 ( 31.3) |
123 ( 42.6) |
109 ( 30.6) |
25 ( 31.6) |
12 ( 20.0) |
770 ( 34.0) |
|
8 ( 0.4) |
14 ( 0.6) |
32 ( 1.4) |
5 ( 0.2) |
465 ( 20.5) |
234 ( 10.3) |
282 ( 12.5) |
441 ( 19.5) |
289 ( 12.8) |
356 ( 15.7) |
79 ( 3.5) |
60 ( 2.6) |
2265 (100.0) |
Table 2.2.1.2.24 : BMI (by Gender * Age, Type of Diabetes = Other Type)
| CMH Chi-Square |
p.value |
df |
| 3288.2715 |
0 |
47 |

|
Trellis Barplot: 2.2.1.2.254 - BMI * Gender * Age (Type of Diabetes = Type 1)

|
Trellis Barplot: 2.2.1.2.255 - BMI * Gender * Age (Type of Diabetes = Type 2)

|
Trellis Barplot: 2.2.1.2.256 - BMI * Gender * Age (Type of Diabetes = Other Type)

|
Boxplot: 2.2.1.2.1 - BMI (by Type of Diabetes)

|
Boxplot: 2.2.1.2.2 - BMI (by Data source, Type of Diabetes = Type 1)

|
Boxplot: 2.2.1.2.3 - BMI (by Data source, Type of Diabetes = Type 2)

|
Boxplot: 2.2.1.2.4 - BMI (by Data source, Type of Diabetes = Other Type)

|
Boxplot: 2.2.1.2.5 - BMI (by Gender)
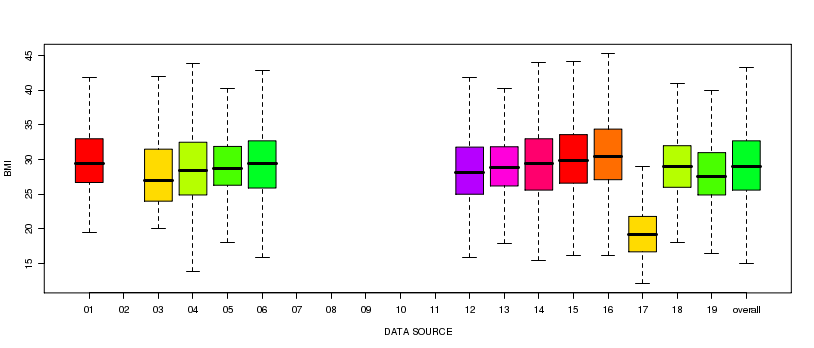
|
Boxplot: 2.2.1.2.6 - BMI (by Data source, Gender = Male)
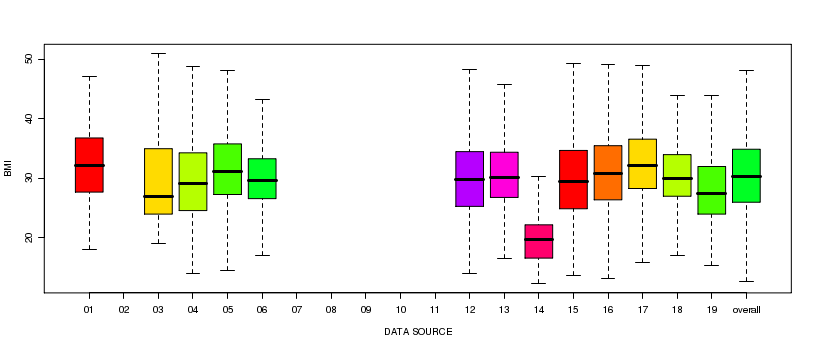
|
Boxplot: 2.2.1.2.7 - BMI (by Data source, Gender = Female)
|
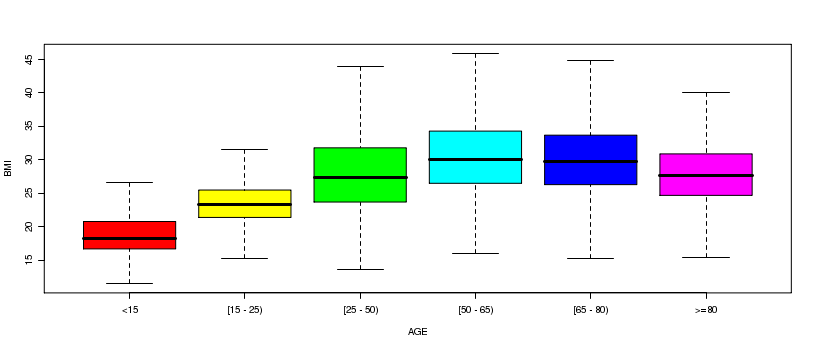
Boxplot: 2.2.1.2.8 - BMI (by Age)
|
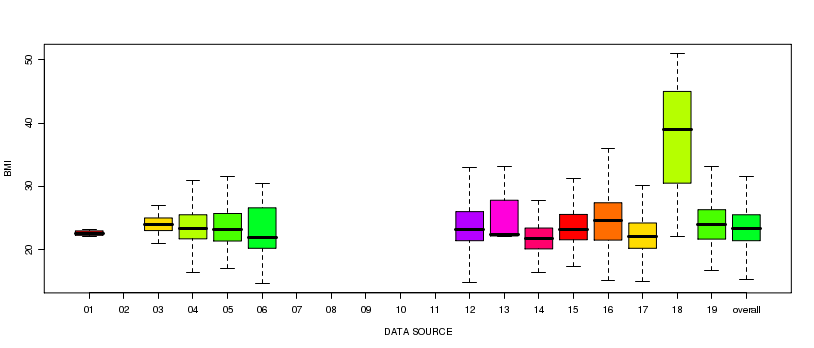
Boxplot: 2.2.1.2.9 - BMI (by Data source, Age = [15 - 25))

|
Boxplot: 2.2.1.2.10 - BMI (by Data source, Age = [25 - 50))

|
Boxplot: 2.2.1.2.11 - BMI (by Data source, Age = [50 - 65))

|
Boxplot: 2.2.1.2.12 - BMI (by Data source, Age = [65 - 80))

|
Boxplot: 2.2.1.2.13 - BMI (by Data source, Age = >=80)

|
Boxplot: 2.2.1.2.14 - BMI (by Data source, Age = <15)

|
Boxplot: 2.2.1.2.15 - BMI (by Gender, Type of Diabetes = Type 1)

|
Boxplot: 2.2.1.2.16 - BMI (by Data source, Gender = Male, Type of Diabetes = Type 1)

|
Boxplot: 2.2.1.2.17 - BMI (by Data source, Gender = Female, Type of Diabetes = Type 1)

|
Boxplot: 2.2.1.2.18 - BMI (by Age, Type of Diabetes = Type 1)

|
Boxplot: 2.2.1.2.19 - BMI (by Data source, Age = [15 - 25), Type of Diabetes = Type 1)

|
Boxplot: 2.2.1.2.20 - BMI (by Data source, Age = [25 - 50), Type of Diabetes = Type 1)

|
Boxplot: 2.2.1.2.21 - BMI (by Data source, Age = [50 - 65), Type of Diabetes = Type 1)

|
Boxplot: 2.2.1.2.22 - BMI (by Data source, Age = [65 - 80), Type of Diabetes = Type 1)

|
Boxplot: 2.2.1.2.23 - BMI (by Data source, Age = >=80, Type of Diabetes = Type 1)

|
Boxplot: 2.2.1.2.24 - BMI (by Data source, Age = <15, Type of Diabetes = Type 1)

|
Boxplot: 2.2.1.2.25 - BMI (by Gender, Type of Diabetes = Type 2)

|
Boxplot: 2.2.1.2.26 - BMI (by Data source, Gender = Male, Type of Diabetes = Type 2)

|
Boxplot: 2.2.1.2.27 - BMI (by Data source, Gender = Female, Type of Diabetes = Type 2)

|
Boxplot: 2.2.1.2.28 - BMI (by Age, Type of Diabetes = Type 2)

|
Boxplot: 2.2.1.2.29 - BMI (by Data source, Age = [25 - 50), Type of Diabetes = Type 2)

|
Boxplot: 2.2.1.2.30 - BMI (by Data source, Age = [50 - 65), Type of Diabetes = Type 2)

|
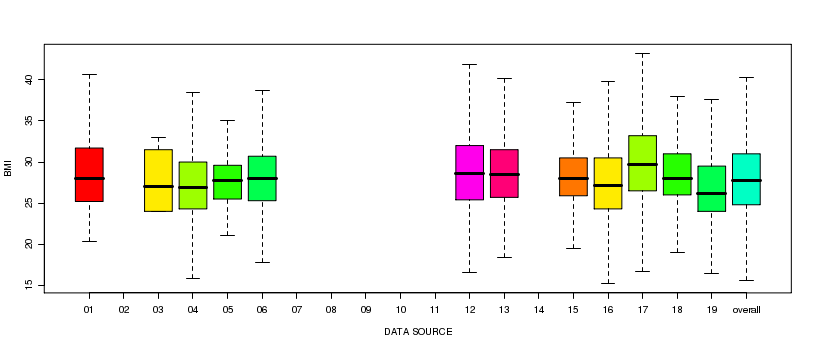
Boxplot: 2.2.1.2.31 - BMI (by Data source, Age = [65 - 80), Type of Diabetes = Type 2)
|
Boxplot: 2.2.1.2.32 - BMI (by Data source, Age = >=80, Type of Diabetes = Type 2)

|
Boxplot: 2.2.1.2.33 - BMI (by Data source, Age = [15 - 25), Type of Diabetes = Type 2)

|
Boxplot: 2.2.1.2.34 - BMI (by Data source, Age = <15, Type of Diabetes = Type 2)

|
Boxplot: 2.2.1.2.35 - BMI (by Gender, Type of Diabetes = Other Type)

|
Boxplot: 2.2.1.2.36 - BMI (by Data source, Gender = Female, Type of Diabetes = Other Type)

|
Boxplot: 2.2.1.2.37 - BMI (by Data source, Gender = Male, Type of Diabetes = Other Type)

|
Boxplot: 2.2.1.2.38 - BMI (by Age, Type of Diabetes = Other Type)

|
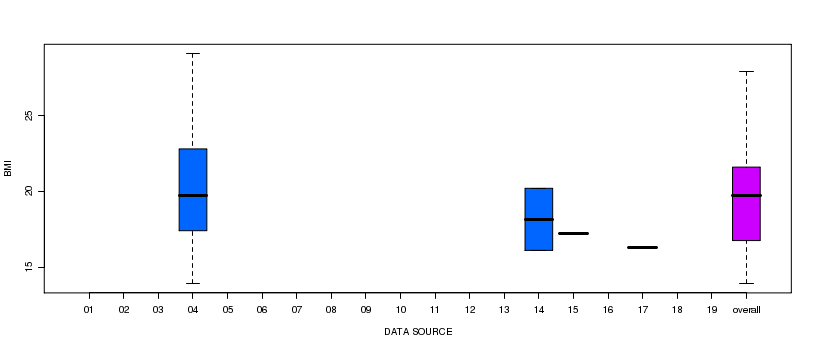
Boxplot: 2.2.1.2.39 - BMI (by Data source, Age = [25 - 50), Type of Diabetes = Other Type)
|
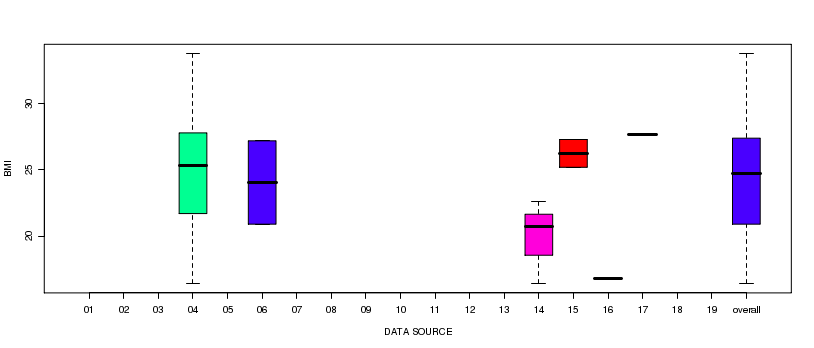
Boxplot: 2.2.1.2.40 - BMI (by Data source, Age = <15, Type of Diabetes = Other Type)
|
Boxplot: 2.2.1.2.41 - BMI (by Data source, Age = [15 - 25), Type of Diabetes = Other Type)

|
Boxplot: 2.2.1.2.42 - BMI (by Data source, Age = [50 - 65), Type of Diabetes = Other Type)

|
Boxplot: 2.2.1.2.43 - BMI (by Data source, Age = [65 - 80), Type of Diabetes = Other Type)

|
Boxplot: 2.2.1.2.44 - BMI (by Data source, Age = >=80, Type of Diabetes = Other Type)

|
Trellis Boxplot: 2.2.1.2.45 - BMI * Gender * Age (Type of Diabetes = Type 1)

|
Trellis Boxplot: 2.2.1.2.46 - BMI * Gender * Age (Type of Diabetes = Type 2)

|
Trellis Boxplot: 2.2.1.2.47 - BMI * Gender * Age (Type of Diabetes = Other Type)
