| Weight |
Valid Value (%) |
NV/NA (%) |
|
| Valid Value |
172196 ( 86.2) |
0 ( 0.0) |
172196 ( 86.2) |
| NV/NA |
27545 ( 13.8) |
0 ( 0.0) |
27545 ( 13.8) |
|
199741 (100.0) |
0 ( 0.0) |
199741 (100.0) |
Table 2.2.1.1.1 : Weight (by Type of Diabetes)
| CMH Chi-Square |
p.value |
df |
| 104755.217 |
0 |
1 |

|
Barplot 2.2.1.1.1 - Weight (by Type of Diabetes)
| Weight |
Type 1 (%) |
Type 2 (%) |
Other Type (%) |
|
| <50 |
1090 ( 6.1) |
1025 ( 0.7) |
77 ( 2.8) |
2192 ( 1.3) |
| [50 - 70) |
6407 ( 35.7) |
24642 ( 16.3) |
869 ( 31.4) |
31918 ( 18.5) |
| [70 - 90) |
7642 ( 42.5) |
67069 ( 44.3) |
1200 ( 43.3) |
75911 ( 44.1) |
| [90 - 110) |
2420 ( 13.5) |
42734 ( 28.2) |
482 ( 17.4) |
45636 ( 26.5) |
| [110 - 130) |
349 ( 1.9) |
12291 ( 8.1) |
116 ( 4.2) |
12756 ( 7.4) |
| >=130 |
60 ( 0.3) |
3696 ( 2.4) |
27 ( 1.0) |
3783 ( 2.2) |
|
17968 ( 10.4) |
151457 ( 88.0) |
2771 ( 1.6) |
172196 (100.0) |
Table 2.2.1.1.2 : Weight (by Type of Diabetes)
| CMH Chi-Square |
p.value |
df |
| 9849.5958 |
0 |
10 |

|
Barplot 2.2.1.1.2 - Weight (by Type of Diabetes)

|
Barplot 2.2.1.1.2a - Weight (by Data Source, Type of Diabetes = Type 1)

|
Barplot 2.2.1.1.2b - Weight (by Data Source, Type of Diabetes = Type 2)

|
Barplot 2.2.1.1.2c - Weight (by Data Source, Type of Diabetes = Other Type)
| Weight |
Valid Value (%) |
NV/NA (%) |
|
| Valid Value |
172196 ( 86.2) |
0 ( 0.0) |
172196 ( 86.2) |
| NV/NA |
27545 ( 13.8) |
0 ( 0.0) |
27545 ( 13.8) |
|
199741 (100.0) |
0 ( 0.0) |
199741 (100.0) |
Table 2.2.1.1.3 : Weight (by Gender)
| CMH Chi-Square |
p.value |
df |
| 104755.217 |
0 |
1 |

|
Barplot 2.2.1.1.3 - Weight (by Gender)
| Weight |
Male (%) |
Female (%) |
|
| <50 |
562 ( 0.7) |
1630 ( 1.8) |
2192 ( 1.3) |
| [50 - 70) |
8256 ( 10.0) |
23662 ( 26.4) |
31918 ( 18.5) |
| [70 - 90) |
36635 ( 44.4) |
39276 ( 43.8) |
75911 ( 44.1) |
| [90 - 110) |
26803 ( 32.4) |
18833 ( 21.0) |
45636 ( 26.5) |
| [110 - 130) |
7942 ( 9.6) |
4814 ( 5.4) |
12756 ( 7.4) |
| >=130 |
2405 ( 2.9) |
1378 ( 1.5) |
3783 ( 2.2) |
|
82603 ( 48.0) |
89593 ( 52.0) |
172196 (100.0) |
Table 2.2.1.1.4 : Weight (by Gender)
| CMH Chi-Square |
p.value |
df |
| 10219.166 |
0 |
5 |

|
Barplot 2.2.1.1.4 - Weight (by Gender)

|
Barplot 2.2.1.1.4a - Weight (by Data Source, Gender = Male)

|
Barplot 2.2.1.1.4b - Weight (by Data Source, Gender = Female)
| Weight |
Valid Value (%) |
NV/NA (%) |
|
| Valid Value |
172196 ( 86.2) |
0 ( 0.0) |
172196 ( 86.2) |
| NV/NA |
27545 ( 13.8) |
0 ( 0.0) |
27545 ( 13.8) |
|
199741 (100.0) |
0 ( 0.0) |
199741 (100.0) |
Table 2.2.1.1.5 : Weight (by Age)
| CMH Chi-Square |
p.value |
df |
| 104755.217 |
0 |
1 |

|
Barplot 2.2.1.1.5 - Weight (by Age)
| Weight |
<15 (%) |
[15 - 25) (%) |
[25 - 50) (%) |
[50 - 65) (%) |
[65 - 80) (%) |
>=80 (%) |
|
| <50 |
736 ( 74.8) |
112 ( 4.1) |
230 ( 1.1) |
277 ( 0.5) |
438 ( 0.6) |
399 ( 2.2) |
2192 ( 1.3) |
| [50 - 70) |
212 ( 21.5) |
1334 ( 48.7) |
4322 ( 20.6) |
7094 ( 12.6) |
12909 ( 17.8) |
6047 ( 32.9) |
31918 ( 18.5) |
| [70 - 90) |
32 ( 3.3) |
1038 ( 37.9) |
7769 ( 37.1) |
22967 ( 40.6) |
35146 ( 48.4) |
8959 ( 48.8) |
75911 ( 44.1) |
| [90 - 110) |
2 ( 0.2) |
206 ( 7.5) |
5437 ( 25.9) |
18222 ( 32.2) |
19140 ( 26.4) |
2629 ( 14.3) |
45636 ( 26.5) |
| [110 - 130) |
2 ( 0.2) |
34 ( 1.2) |
2205 ( 10.5) |
6053 ( 10.7) |
4168 ( 5.7) |
294 ( 1.6) |
12756 ( 7.4) |
| >=130 |
0 ( 0.0) |
14 ( 0.5) |
1005 ( 4.8) |
1907 ( 3.4) |
824 ( 1.1) |
33 ( 0.2) |
3783 ( 2.2) |
|
984 ( 0.6) |
2738 ( 1.6) |
20968 ( 12.2) |
56520 ( 32.8) |
72625 ( 42.2) |
18361 ( 10.7) |
172196 (100.0) |
Table 2.2.1.1.6 : Weight (by Age)
| CMH Chi-Square |
p.value |
df |
| 54912.6631 |
0 |
25 |

|
Barplot 2.2.1.1.6 - Weight (by Age)

|
Barplot 2.2.1.1.6a - Weight (by Data Source, Age = <15)

|
Barplot 2.2.1.1.6b - Weight (by Data Source, Age = [15 - 25))

|
Barplot 2.2.1.1.6c - Weight (by Data Source, Age = [25 - 50))

|
Barplot 2.2.1.1.6d - Weight (by Data Source, Age = [50 - 65))

|
Barplot 2.2.1.1.6e - Weight (by Data Source, Age = [65 - 80))

|
Barplot 2.2.1.1.6f - Weight (by Data Source, Age = >=80)
| Weight |
Gender |
|
| Valid Value (%) |
NV/NA (%) |
|
| Valid Value |
17968 ( 87.6) |
0 ( 0.0) |
17968 ( 87.6) |
| NV/NA |
2555 ( 12.4) |
0 ( 0.0) |
2555 ( 12.4) |
|
20523 (100.0) |
0 ( 0.0) |
20523 (100.0) |
Table 2.2.1.1.7 : Weight (by Gender, Type of Diabetes = Type 1)
| CMH Chi-Square |
p.value |
df |
| 11575.3335 |
0 |
1 |

|
Barplot 2.2.1.1.7 - Weight (by Gender, Type of Diabetes = Type 1)
| Weight |
Gender |
|
| Male (%) |
Female (%) |
|
| <50 |
441 ( 4.5) |
649 ( 7.9) |
1090 ( 6.1) |
| [50 - 70) |
2061 ( 21.1) |
4346 ( 52.9) |
6407 ( 35.7) |
| [70 - 90) |
5017 ( 51.5) |
2625 ( 31.9) |
7642 ( 42.5) |
| [90 - 110) |
1908 ( 19.6) |
512 ( 6.2) |
2420 ( 13.5) |
| [110 - 130) |
270 ( 2.8) |
79 ( 1.0) |
349 ( 1.9) |
| >=130 |
49 ( 0.5) |
11 ( 0.1) |
60 ( 0.3) |
|
9746 ( 54.2) |
8222 ( 45.8) |
17968 (100.0) |
Table 2.2.1.1.8 : Weight (by Gender, Type of Diabetes = Type 1)
| CMH Chi-Square |
p.value |
df |
| 2425.4089 |
0 |
5 |

|
Barplot 2.2.1.1.8 - Weight (by Gender, Type of Diabetes = Type 1)

|
Barplot 2.2.1.1.8a - Weight (by Data Source, Gender = Male, Type of Diabetes=Type 1)

|
Barplot 2.2.1.1.8b - Weight (by Data Source, Gender = Female, Type of Diabetes=Type 1)
| Weight |
Age |
|
| Valid Value (%) |
NV/NA (%) |
|
| Valid Value |
17968 ( 87.6) |
0 ( 0.0) |
17968 ( 87.6) |
| NV/NA |
2555 ( 12.4) |
0 ( 0.0) |
2555 ( 12.4) |
|
20523 (100.0) |
0 ( 0.0) |
20523 (100.0) |
Table 2.2.1.1.9 : Weight (by Age, Type of Diabetes = Type 1)
| CMH Chi-Square |
p.value |
df |
| 11575.3335 |
0 |
1 |

|
Barplot 2.2.1.1.9 - Weight (by Gender, Type of Diabetes = Type 1)
| Weight |
Age |
|
| <15 (%) |
[15 - 25) (%) |
[25 - 50) (%) |
[50 - 65) (%) |
[65 - 80) (%) |
>=80 (%) |
|
| <50 |
718 ( 75.9) |
101 ( 4.0) |
155 ( 1.8) |
81 ( 2.0) |
27 ( 1.6) |
8 ( 3.5) |
1090 ( 6.1) |
| [50 - 70) |
200 ( 21.1) |
1279 ( 50.4) |
2957 ( 34.8) |
1297 ( 31.7) |
563 ( 33.7) |
111 ( 48.1) |
6407 ( 35.7) |
| [70 - 90) |
26 ( 2.7) |
972 ( 38.3) |
3837 ( 45.2) |
1895 ( 46.3) |
822 ( 49.2) |
90 ( 39.0) |
7642 ( 42.5) |
| [90 - 110) |
2 ( 0.2) |
169 ( 6.7) |
1311 ( 15.4) |
698 ( 17.0) |
220 ( 13.2) |
20 ( 8.7) |
2420 ( 13.5) |
| [110 - 130) |
0 ( 0.0) |
13 ( 0.5) |
196 ( 2.3) |
104 ( 2.5) |
34 ( 2.0) |
2 ( 0.9) |
349 ( 1.9) |
| >=130 |
0 ( 0.0) |
5 ( 0.2) |
32 ( 0.4) |
19 ( 0.5) |
4 ( 0.2) |
0 ( 0.0) |
60 ( 0.3) |
|
946 ( 5.3) |
2539 ( 14.1) |
8488 ( 47.2) |
4094 ( 22.8) |
1670 ( 9.3) |
231 ( 1.3) |
17968 (100.0) |
Table 2.2.1.1.10 : Weight (by Age, Type of Diabetes = Type 1)
| CMH Chi-Square |
p.value |
df |
| 9041.7345 |
0 |
25 |

|
Barplot 2.2.1.1.10 - Weight (by Age, Type of Diabetes = Type 1)

|
Barplot 2.2.1.1.10a - Weight (by Data Source, Age = <15, Type of Diabetes=Type 1)

|
Barplot 2.2.1.1.10b - Weight (by Data Source, Age = [15 - 25), Type of Diabetes=Type 1)

|
Barplot 2.2.1.1.10c - Weight (by Data Source, Age = [25 - 50), Type of Diabetes=Type 1)

|
Barplot 2.2.1.1.10d - Weight (by Data Source, Age = [50 - 65), Type of Diabetes=Type 1)

|
Barplot 2.2.1.1.10e - Weight (by Data Source, Age = [65 - 80), Type of Diabetes=Type 1)

|
Barplot 2.2.1.1.10f - Weight (by Data Source, Age = >=80, Type of Diabetes=Type 1)
| Weight |
Gender * Age |
|
| Valid Value |
NV/NA |
|
Valid Value (%) |
NV/NA (%) |
Valid Value (%) |
NV/NA (%) |
|
| Valid Value |
17968 ( 87.6) |
0 ( 0.0) |
0 ( 0.0) |
0 ( 0.0) |
17968 ( 87.6) |
| NV/NA |
2555 ( 12.4) |
0 ( 0.0) |
0 ( 0.0) |
0 ( 0.0) |
2555 ( 12.4) |
|
20523 (100.0) |
0 ( 0.0) |
0 ( 0.0) |
0 ( 0.0) |
20523 (100.0) |
Table 2.2.1.1.11 : Weight (by Gender * Age, Type of Diabetes = Type 1)
| Weight |
Gender * Age |
|
| <15 |
[15 - 25) |
[25 - 50) |
[50 - 65) |
[65 - 80) |
>=80 |
|
Male (%) |
Female (%) |
Male (%) |
Female (%) |
Male (%) |
Female (%) |
Male (%) |
Female (%) |
Male (%) |
Female (%) |
Male (%) |
Female (%) |
|
| <50 |
326 ( 72.3) |
392 ( 79.2) |
69 ( 6.0) |
32 ( 2.3) |
146 ( 3.9) |
9 ( 0.2) |
75 ( 4.1) |
6 ( 0.3) |
26 ( 2.9) |
1 ( 0.1) |
7 ( 5.3) |
1 ( 1.0) |
1090 ( 6.1) |
| [50 - 70) |
111 ( 24.6) |
89 ( 18.0) |
772 ( 67.2) |
507 ( 36.5) |
2063 ( 54.6) |
894 ( 19.0) |
902 ( 49.3) |
395 ( 17.4) |
420 ( 47.5) |
143 ( 18.2) |
78 ( 59.5) |
33 ( 33.0) |
6407 ( 35.7) |
| [70 - 90) |
12 ( 2.7) |
14 ( 2.8) |
274 ( 23.8) |
698 ( 50.2) |
1268 ( 33.6) |
2569 ( 54.5) |
674 ( 36.8) |
1221 ( 53.9) |
357 ( 40.3) |
465 ( 59.2) |
40 ( 30.5) |
50 ( 50.0) |
7642 ( 42.5) |
| [90 - 110) |
2 ( 0.4) |
0 ( 0.0) |
31 ( 2.7) |
138 ( 9.9) |
248 ( 6.6) |
1063 ( 22.6) |
154 ( 8.4) |
544 ( 24.0) |
72 ( 8.1) |
148 ( 18.9) |
5 ( 3.8) |
15 ( 15.0) |
2420 ( 13.5) |
| [110 - 130) |
0 ( 0.0) |
0 ( 0.0) |
2 ( 0.2) |
11 ( 0.8) |
43 ( 1.1) |
153 ( 3.2) |
23 ( 1.3) |
81 ( 3.6) |
10 ( 1.1) |
24 ( 3.1) |
1 ( 0.8) |
1 ( 1.0) |
349 ( 1.9) |
| >=130 |
0 ( 0.0) |
0 ( 0.0) |
1 ( 0.1) |
4 ( 0.3) |
8 ( 0.2) |
24 ( 0.5) |
2 ( 0.1) |
17 ( 0.8) |
0 ( 0.0) |
4 ( 0.5) |
0 ( 0.0) |
0 ( 0.0) |
60 ( 0.3) |
|
451 ( 2.5) |
495 ( 2.8) |
1149 ( 6.4) |
1390 ( 7.7) |
3776 ( 21.0) |
4712 ( 26.2) |
1830 ( 10.2) |
2264 ( 12.6) |
885 ( 4.9) |
785 ( 4.4) |
131 ( 0.7) |
100 ( 0.6) |
17968 (100.0) |
Table 2.2.1.1.12 : Weight (by Gender * Age, Type of Diabetes = Type 1)
| CMH Chi-Square |
p.value |
df |
| 62380.1451 |
0 |
71 |
| Weight |
Gender |
|
| Valid Value (%) |
NV/NA (%) |
|
| Valid Value |
151457 ( 86.4) |
0 ( 0.0) |
151457 ( 86.4) |
| NV/NA |
23891 ( 13.6) |
0 ( 0.0) |
23891 ( 13.6) |
|
175348 (100.0) |
0 ( 0.0) |
175348 (100.0) |
Table 2.2.1.1.13 : Weight (by Gender, Type of Diabetes = Type 2)
| CMH Chi-Square |
p.value |
df |
| 92804.5051 |
0 |
1 |

|
Barplot 2.2.1.1.11 - Weight (by Gender, Type of Diabetes = Type 2)
| Weight |
Gender |
|
| Male (%) |
Female (%) |
|
| <50 |
104 ( 0.1) |
921 ( 1.2) |
1025 ( 0.7) |
| [50 - 70) |
5980 ( 8.3) |
18662 ( 23.4) |
24642 ( 16.3) |
| [70 - 90) |
31061 ( 43.3) |
36008 ( 45.2) |
67069 ( 44.3) |
| [90 - 110) |
24645 ( 34.4) |
18089 ( 22.7) |
42734 ( 28.2) |
| [110 - 130) |
7608 ( 10.6) |
4683 ( 5.9) |
12291 ( 8.1) |
| >=130 |
2345 ( 3.3) |
1351 ( 1.7) |
3696 ( 2.4) |
|
71743 ( 47.4) |
79714 ( 52.6) |
151457 (100.0) |
Table 2.2.1.1.14 : Weight (by Gender, Type of Diabetes = Type 2)
| CMH Chi-Square |
p.value |
df |
| 9117.8352 |
0 |
5 |
|
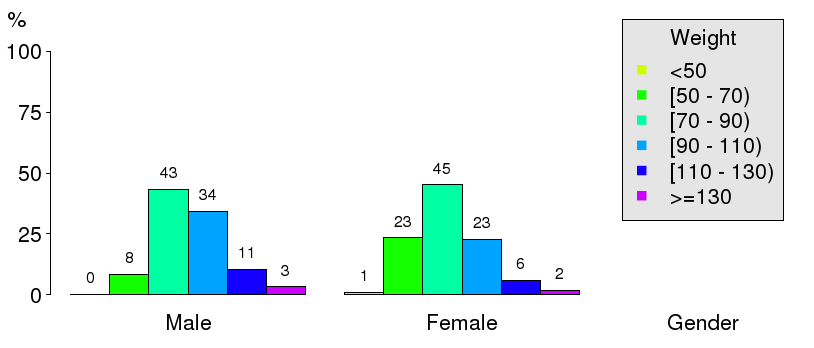
Barplot 2.2.1.1.12 - Weight (by Gender, Type of Diabetes = Type 2)

|
Barplot 2.2.1.1.12a - Weight (by Data Source, Gender = Male, Type of Diabetes=Type 2)

|
Barplot 2.2.1.1.12b - Weight (by Data Source, Gender = Female, Type of Diabetes=Type 2)
| Weight |
Age |
|
| Valid Value (%) |
NV/NA (%) |
|
| Valid Value |
151457 ( 86.4) |
0 ( 0.0) |
151457 ( 86.4) |
| NV/NA |
23891 ( 13.6) |
0 ( 0.0) |
23891 ( 13.6) |
|
175348 (100.0) |
0 ( 0.0) |
175348 (100.0) |
Table 2.2.1.1.15 : Weight (by Age, Type of Diabetes = Type 2)
| CMH Chi-Square |
p.value |
df |
| 92804.5051 |
0 |
1 |

|
Barplot 2.2.1.1.13 - Weight (by Gender, Type of Diabetes = Type 2)
| Weight |
Age |
|
| <15 (%) |
[15 - 25) (%) |
[25 - 50) (%) |
[50 - 65) (%) |
[65 - 80) (%) |
>=80 (%) |
|
| <50 |
0 ( 0.0) |
4 ( 3.3) |
57 ( 0.5) |
177 ( 0.3) |
402 ( 0.6) |
385 ( 2.1) |
1025 ( 0.7) |
| [50 - 70) |
6 ( 46.2) |
17 ( 14.0) |
960 ( 8.5) |
5594 ( 10.8) |
12179 ( 17.3) |
5886 ( 32.7) |
24642 ( 16.3) |
| [70 - 90) |
6 ( 46.2) |
42 ( 34.7) |
3443 ( 30.4) |
20732 ( 40.1) |
34026 ( 48.4) |
8820 ( 49.0) |
67069 ( 44.3) |
| [90 - 110) |
0 ( 0.0) |
29 ( 24.0) |
3937 ( 34.8) |
17389 ( 33.6) |
18785 ( 26.7) |
2594 ( 14.4) |
42734 ( 28.2) |
| [110 - 130) |
1 ( 7.7) |
20 ( 16.5) |
1958 ( 17.3) |
5911 ( 11.4) |
4114 ( 5.9) |
287 ( 1.6) |
12291 ( 8.1) |
| >=130 |
0 ( 0.0) |
9 ( 7.4) |
954 ( 8.4) |
1883 ( 3.6) |
817 ( 1.2) |
33 ( 0.2) |
3696 ( 2.4) |
|
13 ( 0.0) |
121 ( 0.1) |
11309 ( 7.5) |
51686 ( 34.1) |
70323 ( 46.4) |
18005 ( 11.9) |
151457 (100.0) |
Table 2.2.1.1.16 : Weight (by Age, Type of Diabetes = Type 2)
| CMH Chi-Square |
p.value |
df |
| 14240.6986 |
0 |
25 |

|
Barplot 2.2.1.1.14 - Weight (by Age, Type of Diabetes = Type 2)

|
Barplot 2.2.1.1.14a - Weight (by Data Source, Age = <15, Type of Diabetes=Type 2)

|
Barplot 2.2.1.1.14b - Weight (by Data Source, Age = [15 - 25), Type of Diabetes=Type 2)

|
Barplot 2.2.1.1.14c - Weight (by Data Source, Age = [25 - 50), Type of Diabetes=Type 2)

|
Barplot 2.2.1.1.14d - Weight (by Data Source, Age = [50 - 65), Type of Diabetes=Type 2)

|
Barplot 2.2.1.1.14e - Weight (by Data Source, Age = [65 - 80), Type of Diabetes=Type 2)

|
Barplot 2.2.1.1.14f - Weight (by Data Source, Age = >=80, Type of Diabetes=Type 2)
| Weight |
Gender * Age |
|
| Valid Value |
NV/NA |
|
Valid Value (%) |
NV/NA (%) |
Valid Value (%) |
NV/NA (%) |
|
| Valid Value |
151457 ( 86.4) |
0 ( 0.0) |
0 ( 0.0) |
0 ( 0.0) |
151457 ( 86.4) |
| NV/NA |
23891 ( 13.6) |
0 ( 0.0) |
0 ( 0.0) |
0 ( 0.0) |
23891 ( 13.6) |
|
175348 (100.0) |
0 ( 0.0) |
0 ( 0.0) |
0 ( 0.0) |
175348 (100.0) |
Table 2.2.1.1.17 : Weight (by Gender * Age, Type of Diabetes = Type 2)
| Weight |
Gender * Age |
|
| <15 |
[15 - 25) |
[25 - 50) |
[50 - 65) |
[65 - 80) |
>=80 |
|
Male (%) |
Female (%) |
Male (%) |
Female (%) |
Male (%) |
Female (%) |
Male (%) |
Female (%) |
Male (%) |
Female (%) |
Male (%) |
Female (%) |
|
| <50 |
0 ( 0.0) |
0 ( 0.0) |
3 ( 4.3) |
1 ( 2.0) |
47 ( 1.0) |
10 ( 0.1) |
147 ( 0.6) |
30 ( 0.1) |
369 ( 0.9) |
33 ( 0.1) |
355 ( 3.1) |
30 ( 0.5) |
1025 ( 0.7) |
| [50 - 70) |
3 ( 60.0) |
3 ( 37.5) |
14 ( 20.0) |
3 ( 5.9) |
650 ( 14.1) |
310 ( 4.6) |
4054 ( 16.6) |
1540 ( 5.6) |
9317 ( 23.8) |
2862 ( 9.2) |
4624 ( 40.2) |
1262 ( 19.4) |
24642 ( 16.3) |
| [70 - 90) |
2 ( 40.0) |
4 ( 50.0) |
25 ( 35.7) |
17 ( 33.3) |
1555 ( 33.6) |
1888 ( 28.3) |
10527 ( 43.1) |
10205 ( 37.4) |
18774 ( 48.0) |
15252 ( 48.9) |
5125 ( 44.5) |
3695 ( 56.9) |
67069 ( 44.3) |
| [90 - 110) |
0 ( 0.0) |
0 ( 0.0) |
18 ( 25.7) |
11 ( 21.6) |
1426 ( 30.8) |
2511 ( 37.6) |
6830 ( 28.0) |
10559 ( 38.7) |
8550 ( 21.9) |
10235 ( 32.8) |
1265 ( 11.0) |
1329 ( 20.5) |
42734 ( 28.2) |
| [110 - 130) |
0 ( 0.0) |
1 ( 12.5) |
8 ( 11.4) |
12 ( 23.5) |
636 ( 13.7) |
1322 ( 19.8) |
2156 ( 8.8) |
3755 ( 13.8) |
1755 ( 4.5) |
2359 ( 7.6) |
128 ( 1.1) |
159 ( 2.4) |
12291 ( 8.1) |
| >=130 |
0 ( 0.0) |
0 ( 0.0) |
2 ( 2.9) |
7 ( 13.7) |
312 ( 6.7) |
642 ( 9.6) |
686 ( 2.8) |
1197 ( 4.4) |
337 ( 0.9) |
480 ( 1.5) |
14 ( 0.1) |
19 ( 0.3) |
3696 ( 2.4) |
|
5 ( 0.0) |
8 ( 0.0) |
70 ( 0.0) |
51 ( 0.0) |
4626 ( 3.1) |
6683 ( 4.4) |
24400 ( 16.1) |
27286 ( 18.0) |
39102 ( 25.8) |
31221 ( 20.6) |
11511 ( 7.6) |
6494 ( 4.3) |
151457 (100.0) |
Table 2.2.1.1.18 : Weight (by Gender * Age, Type of Diabetes = Type 2)
| CMH Chi-Square |
p.value |
df |
| 496766.8143 |
0 |
71 |
| Weight |
Gender |
|
| Valid Value (%) |
NV/NA (%) |
|
| Valid Value |
2771 ( 71.6) |
0 ( 0.0) |
2771 ( 71.6) |
| NV/NA |
1099 ( 28.4) |
0 ( 0.0) |
1099 ( 28.4) |
|
3870 (100.0) |
0 ( 0.0) |
3870 (100.0) |
Table 2.2.1.1.19 : Weight (by Gender, Type of Diabetes = Other Type)
| CMH Chi-Square |
p.value |
df |
| 722.3731 |
0 |
1 |

|
Barplot 2.2.1.1.15 - Weight (by Gender, Type of Diabetes = Other Type)
| Weight |
Gender |
|
| Male (%) |
Female (%) |
|
| <50 |
17 ( 1.5) |
60 ( 3.6) |
77 ( 2.8) |
| [50 - 70) |
215 ( 19.3) |
654 ( 39.5) |
869 ( 31.4) |
| [70 - 90) |
557 ( 50.0) |
643 ( 38.8) |
1200 ( 43.3) |
| [90 - 110) |
250 ( 22.4) |
232 ( 14.0) |
482 ( 17.4) |
| [110 - 130) |
64 ( 5.7) |
52 ( 3.1) |
116 ( 4.2) |
| >=130 |
11 ( 1.0) |
16 ( 1.0) |
27 ( 1.0) |
|
1114 ( 40.2) |
1657 ( 59.8) |
2771 (100.0) |
Table 2.2.1.1.20 : Weight (by Gender, Type of Diabetes = Other Type)
| CMH Chi-Square |
p.value |
df |
| 154.3093 |
0 |
5 |

|
Barplot 2.2.1.1.16 - Weight (by Gender, Type of Diabetes = Other Type)

|
Barplot 2.2.1.1.16a - Weight (by Data Source, Gender = Male, Type of Diabetes=Other Type)

|
Barplot 2.2.1.1.16b - Weight (by Data Source, Gender = Female, Type of Diabetes=Other Type)
| Weight |
Age |
|
| Valid Value (%) |
NV/NA (%) |
|
| Valid Value |
2771 ( 71.6) |
0 ( 0.0) |
2771 ( 71.6) |
| NV/NA |
1099 ( 28.4) |
0 ( 0.0) |
1099 ( 28.4) |
|
3870 (100.0) |
0 ( 0.0) |
3870 (100.0) |
Table 2.2.1.1.21 : Weight (by Age, Type of Diabetes = Other Type)
| CMH Chi-Square |
p.value |
df |
| 722.3731 |
0 |
1 |

|
Barplot 2.2.1.1.17 - Weight (by Gender, Type of Diabetes = Other Type)
| Weight |
Age |
|
| <15 (%) |
[15 - 25) (%) |
[25 - 50) (%) |
[50 - 65) (%) |
[65 - 80) (%) |
>=80 (%) |
|
| <50 |
18 ( 72.0) |
7 ( 9.0) |
18 ( 1.5) |
19 ( 2.6) |
9 ( 1.4) |
6 ( 4.8) |
77 ( 2.8) |
| [50 - 70) |
6 ( 24.0) |
38 ( 48.7) |
405 ( 34.6) |
203 ( 27.4) |
167 ( 26.4) |
50 ( 40.0) |
869 ( 31.4) |
| [70 - 90) |
0 ( 0.0) |
24 ( 30.8) |
489 ( 41.8) |
340 ( 45.9) |
298 ( 47.2) |
49 ( 39.2) |
1200 ( 43.3) |
| [90 - 110) |
0 ( 0.0) |
8 ( 10.3) |
189 ( 16.1) |
135 ( 18.2) |
135 ( 21.4) |
15 ( 12.0) |
482 ( 17.4) |
| [110 - 130) |
1 ( 4.0) |
1 ( 1.3) |
51 ( 4.4) |
38 ( 5.1) |
20 ( 3.2) |
5 ( 4.0) |
116 ( 4.2) |
| >=130 |
0 ( 0.0) |
0 ( 0.0) |
19 ( 1.6) |
5 ( 0.7) |
3 ( 0.5) |
0 ( 0.0) |
27 ( 1.0) |
|
25 ( 0.9) |
78 ( 2.8) |
1171 ( 42.3) |
740 ( 26.7) |
632 ( 22.8) |
125 ( 4.5) |
2771 (100.0) |
Table 2.2.1.1.22 : Weight (by Age, Type of Diabetes = Other Type)
| CMH Chi-Square |
p.value |
df |
| 526.1709 |
0 |
25 |

|
Barplot 2.2.1.1.18 - Weight (by Age, Type of Diabetes = Other Type)

|
Barplot 2.2.1.1.18a - Weight (by Data Source, Age = <15, Type of Diabetes=Other Type)

|
Barplot 2.2.1.1.18b - Weight (by Data Source, Age = [15 - 25), Type of Diabetes=Other Type)

|
Barplot 2.2.1.1.18c - Weight (by Data Source, Age = [25 - 50), Type of Diabetes=Other Type)

|
Barplot 2.2.1.1.18d - Weight (by Data Source, Age = [50 - 65), Type of Diabetes=Other Type)

|
Barplot 2.2.1.1.18e - Weight (by Data Source, Age = [65 - 80), Type of Diabetes=Other Type)

|
Barplot 2.2.1.1.18f - Weight (by Data Source, Age = >=80, Type of Diabetes=Other Type)
| Weight |
Gender * Age |
|
| Valid Value |
NV/NA |
|
Valid Value (%) |
NV/NA (%) |
Valid Value (%) |
NV/NA (%) |
|
| Valid Value |
2771 ( 71.6) |
0 ( 0.0) |
0 ( 0.0) |
0 ( 0.0) |
2771 ( 71.6) |
| NV/NA |
1099 ( 28.4) |
0 ( 0.0) |
0 ( 0.0) |
0 ( 0.0) |
1099 ( 28.4) |
|
3870 (100.0) |
0 ( 0.0) |
0 ( 0.0) |
0 ( 0.0) |
3870 (100.0) |
Table 2.2.1.1.23 : Weight (by Gender * Age, Type of Diabetes = Other Type)
| Weight |
Gender * Age |
|
| <15 |
[15 - 25) |
[25 - 50) |
[50 - 65) |
[65 - 80) |
>=80 |
|
Male (%) |
Female (%) |
Male (%) |
Female (%) |
Male (%) |
Female (%) |
Male (%) |
Female (%) |
Male (%) |
Female (%) |
Male (%) |
Female (%) |
|
| <50 |
7 ( 70.0) |
11 ( 73.3) |
7 ( 9.9) |
0 ( 0.0) |
15 ( 1.6) |
3 ( 1.2) |
17 ( 5.8) |
2 ( 0.4) |
8 ( 2.7) |
1 ( 0.3) |
6 ( 8.6) |
0 ( 0.0) |
77 ( 2.8) |
| [50 - 70) |
2 ( 20.0) |
4 ( 26.7) |
33 ( 46.5) |
5 ( 71.4) |
346 ( 37.7) |
59 ( 23.3) |
117 ( 39.8) |
86 ( 19.3) |
117 ( 39.8) |
50 ( 14.8) |
39 ( 55.7) |
11 ( 20.0) |
869 ( 31.4) |
| [70 - 90) |
0 ( 0.0) |
0 ( 0.0) |
23 ( 32.4) |
1 ( 14.3) |
372 ( 40.5) |
117 ( 46.2) |
108 ( 36.7) |
232 ( 52.0) |
120 ( 40.8) |
178 ( 52.7) |
20 ( 28.6) |
29 ( 52.7) |
1200 ( 43.3) |
| [90 - 110) |
0 ( 0.0) |
0 ( 0.0) |
7 ( 9.9) |
1 ( 14.3) |
137 ( 14.9) |
52 ( 20.6) |
41 ( 13.9) |
94 ( 21.1) |
42 ( 14.3) |
93 ( 27.5) |
5 ( 7.1) |
10 ( 18.2) |
482 ( 17.4) |
| [110 - 130) |
1 ( 10.0) |
0 ( 0.0) |
1 ( 1.4) |
0 ( 0.0) |
32 ( 3.5) |
19 ( 7.5) |
11 ( 3.7) |
27 ( 6.1) |
7 ( 2.4) |
13 ( 3.8) |
0 ( 0.0) |
5 ( 9.1) |
116 ( 4.2) |
| >=130 |
0 ( 0.0) |
0 ( 0.0) |
0 ( 0.0) |
0 ( 0.0) |
16 ( 1.7) |
3 ( 1.2) |
0 ( 0.0) |
5 ( 1.1) |
0 ( 0.0) |
3 ( 0.9) |
0 ( 0.0) |
0 ( 0.0) |
27 ( 1.0) |
|
10 ( 0.4) |
15 ( 0.5) |
71 ( 2.6) |
7 ( 0.3) |
918 ( 33.1) |
253 ( 9.1) |
294 ( 10.6) |
446 ( 16.1) |
294 ( 10.6) |
338 ( 12.2) |
70 ( 2.5) |
55 ( 2.0) |
2771 (100.0) |
Table 2.2.1.1.24 : Weight (by Gender * Age, Type of Diabetes = Other Type)
| CMH Chi-Square |
p.value |
df |
| 9567.659 |
0 |
71 |

|
Trellis Barplot: 2.2.1.1.254 - Weight * Gender * Age (Type of Diabetes = Type 1)

|
Trellis Barplot: 2.2.1.1.255 - Weight * Gender * Age (Type of Diabetes = Type 2)

|
Trellis Barplot: 2.2.1.1.256 - Weight * Gender * Age (Type of Diabetes = Other Type)

|
Boxplot: 2.2.1.1.1 - Weight (by Type of Diabetes)

|
Boxplot: 2.2.1.1.2 - Weight (by Data source, Type of Diabetes = Type 1)

|
Boxplot: 2.2.1.1.3 - Weight (by Data source, Type of Diabetes = Type 2)

|
Boxplot: 2.2.1.1.4 - Weight (by Data source, Type of Diabetes = Other Type)

|
Boxplot: 2.2.1.1.5 - Weight (by Gender)

|
Boxplot: 2.2.1.1.6 - Weight (by Data source, Gender = Male)

|
Boxplot: 2.2.1.1.7 - Weight (by Data source, Gender = Female)

|
Boxplot: 2.2.1.1.8 - Weight (by Age)

|
Boxplot: 2.2.1.1.9 - Weight (by Data source, Age = [15 - 25))

|
Boxplot: 2.2.1.1.10 - Weight (by Data source, Age = [25 - 50))

|
Boxplot: 2.2.1.1.11 - Weight (by Data source, Age = [50 - 65))

|
Boxplot: 2.2.1.1.12 - Weight (by Data source, Age = [65 - 80))

|
Boxplot: 2.2.1.1.13 - Weight (by Data source, Age = >=80)

|
Boxplot: 2.2.1.1.14 - Weight (by Data source, Age = <15)

|
Boxplot: 2.2.1.1.15 - Weight (by Gender, Type of Diabetes = Type 1)

|
Boxplot: 2.2.1.1.16 - Weight (by Data source, Gender = Male, Type of Diabetes = Type 1)

|
Boxplot: 2.2.1.1.17 - Weight (by Data source, Gender = Female, Type of Diabetes = Type 1)

|
Boxplot: 2.2.1.1.18 - Weight (by Age, Type of Diabetes = Type 1)

|
Boxplot: 2.2.1.1.19 - Weight (by Data source, Age = [15 - 25), Type of Diabetes = Type 1)

|
Boxplot: 2.2.1.1.20 - Weight (by Data source, Age = [25 - 50), Type of Diabetes = Type 1)

|
Boxplot: 2.2.1.1.21 - Weight (by Data source, Age = [50 - 65), Type of Diabetes = Type 1)

|
Boxplot: 2.2.1.1.22 - Weight (by Data source, Age = [65 - 80), Type of Diabetes = Type 1)

|
Boxplot: 2.2.1.1.23 - Weight (by Data source, Age = >=80, Type of Diabetes = Type 1)

|
Boxplot: 2.2.1.1.24 - Weight (by Data source, Age = <15, Type of Diabetes = Type 1)

|
Boxplot: 2.2.1.1.25 - Weight (by Gender, Type of Diabetes = Type 2)

|
Boxplot: 2.2.1.1.26 - Weight (by Data source, Gender = Male, Type of Diabetes = Type 2)

|
Boxplot: 2.2.1.1.27 - Weight (by Data source, Gender = Female, Type of Diabetes = Type 2)

|
Boxplot: 2.2.1.1.28 - Weight (by Age, Type of Diabetes = Type 2)

|
Boxplot: 2.2.1.1.29 - Weight (by Data source, Age = [25 - 50), Type of Diabetes = Type 2)

|
Boxplot: 2.2.1.1.30 - Weight (by Data source, Age = [50 - 65), Type of Diabetes = Type 2)

|
Boxplot: 2.2.1.1.31 - Weight (by Data source, Age = [65 - 80), Type of Diabetes = Type 2)

|
Boxplot: 2.2.1.1.32 - Weight (by Data source, Age = >=80, Type of Diabetes = Type 2)

|
Boxplot: 2.2.1.1.33 - Weight (by Data source, Age = [15 - 25), Type of Diabetes = Type 2)

|
Boxplot: 2.2.1.1.34 - Weight (by Data source, Age = <15, Type of Diabetes = Type 2)

|
Boxplot: 2.2.1.1.35 - Weight (by Gender, Type of Diabetes = Other Type)

|
Boxplot: 2.2.1.1.36 - Weight (by Data source, Gender = Female, Type of Diabetes = Other Type)

|
Boxplot: 2.2.1.1.37 - Weight (by Data source, Gender = Male, Type of Diabetes = Other Type)

|
Boxplot: 2.2.1.1.38 - Weight (by Age, Type of Diabetes = Other Type)

|
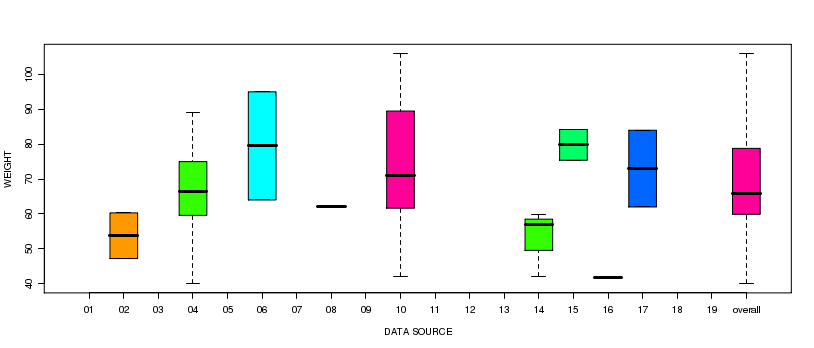
Boxplot: 2.2.1.1.39 - Weight (by Data source, Age = [25 - 50), Type of Diabetes = Other Type)
|
Boxplot: 2.2.1.1.40 - Weight (by Data source, Age = [15 - 25), Type of Diabetes = Other Type)

|
Boxplot: 2.2.1.1.41 - Weight (by Data source, Age = [50 - 65), Type of Diabetes = Other Type)

|
Boxplot: 2.2.1.1.42 - Weight (by Data source, Age = [65 - 80), Type of Diabetes = Other Type)

|
Boxplot: 2.2.1.1.43 - Weight (by Data source, Age = <15, Type of Diabetes = Other Type)

|
Boxplot: 2.2.1.1.44 - Weight (by Data source, Age = >=80, Type of Diabetes = Other Type)

|
Trellis Boxplot: 2.2.1.1.45 - Weight * Gender * Age (Type of Diabetes = Type 1)

|
Trellis Boxplot: 2.2.1.1.46 - Weight * Gender * Age (Type of Diabetes = Type 2)

|
Trellis Boxplot: 2.2.1.1.47 - Weight * Gender * Age (Type of Diabetes = Other Type)
