
|
| BIRO Report site: 319761ea64b939fa1be95f0c7eb6e8c07691f006 |
| Reference date: 18/02/12 |
| Parameter: 2.1.2 Duration of diabetes (Classes) |
| Duration of Diabetes | Valid Value (%) | NV/NA (%) | |
|---|---|---|---|
| Valid Value | 199902 (100.0) | 0 ( 0.0) | 199902 (100.0) |
| NV/NA | 0 ( 0.0) | 0 ( 0.0) | 0 ( 0.0) |
| 199902 (100.0) | 0 ( 0.0) | 199902 (100.0) |
| CMH Chi-Square |
|---|
| Too many cells have 0 obs |

|
| Duration of Diabetes | Type 1 (%) | Type 2 (%) | Other Type (%) | |
|---|---|---|---|---|
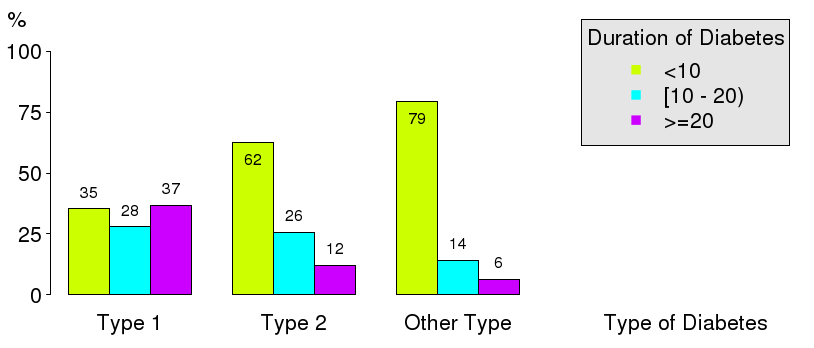
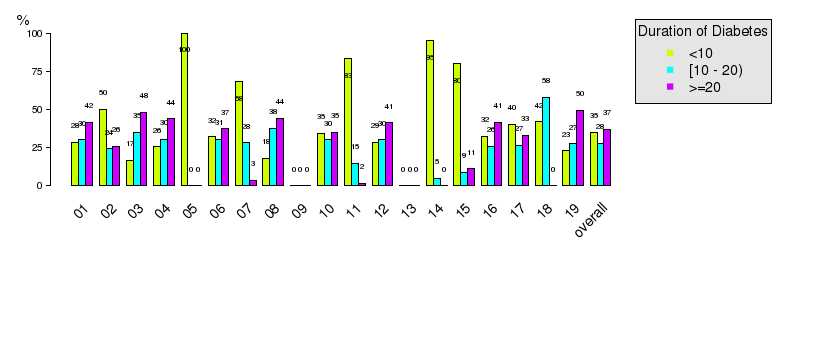
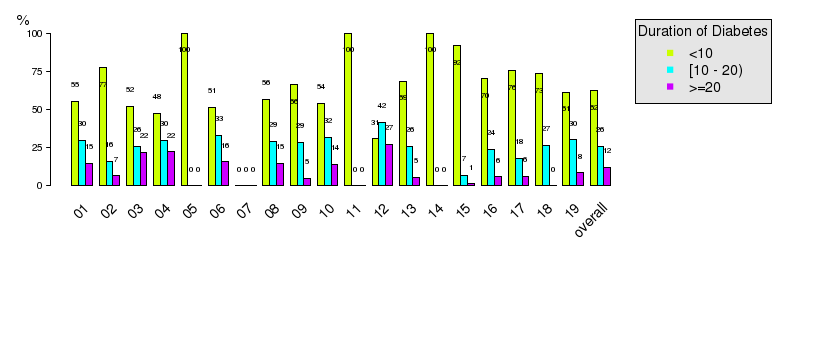
| <10 | 7300 ( 35.3) | 109365 ( 62.4) | 3076 ( 79.5) | 119741 ( 59.9) |
| [10 - 20) | 5768 ( 27.9) | 44948 ( 25.6) | 546 ( 14.1) | 51262 ( 25.6) |
| >=20 | 7615 ( 36.8) | 21036 ( 12.0) | 248 ( 6.4) | 28899 ( 14.5) |
| 20683 ( 10.3) | 175349 ( 87.7) | 3870 ( 1.9) | 199902 (100.0) |
| CMH Chi-Square | p.value | df |
|---|---|---|
| 10819.3963 | 0 | 4 |
|
|
|

|
| Duration of Diabetes | Valid Value (%) | NV/NA (%) | |
|---|---|---|---|
| Valid Value | 199902 (100.0) | 0 ( 0.0) | 199902 (100.0) |
| NV/NA | 0 ( 0.0) | 0 ( 0.0) | 0 ( 0.0) |
| 199902 (100.0) | 0 ( 0.0) | 199902 (100.0) |
| CMH Chi-Square |
|---|
| Too many cells have 0 obs |
|
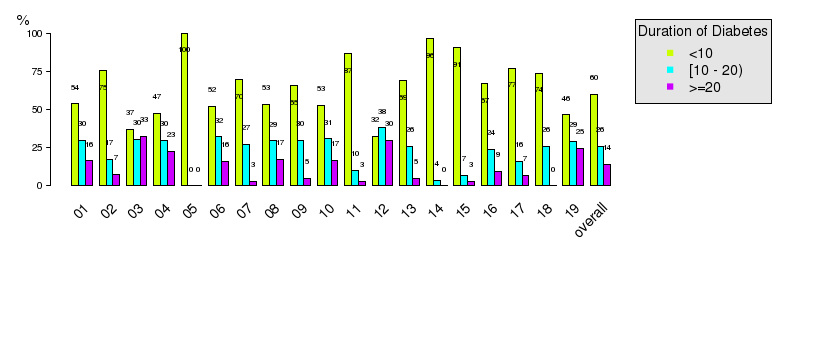
| Duration of Diabetes | Male (%) | Female (%) | |
|---|---|---|---|
| <10 | 57523 ( 59.9) | 62218 ( 59.9) | 119741 ( 59.9) |
| [10 - 20) | 24693 ( 25.7) | 26569 ( 25.6) | 51262 ( 25.6) |
| >=20 | 13747 ( 14.3) | 15152 ( 14.6) | 28899 ( 14.5) |
| 95963 ( 48.0) | 103939 ( 52.0) | 199902 (100.0) |
| CMH Chi-Square | p.value | df |
|---|---|---|
| 2.8173 | 0.2445 | 2 |

|
|

|
| Duration of Diabetes | Gender | ||
|---|---|---|---|
| Valid Value (%) | NV/NA (%) | ||
| Valid Value | 20683 (100.0) | 0 ( 0.0) | 20683 (100.0) |
| NV/NA | 0 ( 0.0) | 0 ( 0.0) | 0 ( 0.0) |
| 20683 (100.0) | 0 ( 0.0) | 20683 (100.0) |
| CMH Chi-Square |
|---|
| Too many cells have 0 obs |

|
| Duration of Diabetes | Gender | ||
|---|---|---|---|
| Male (%) | Female (%) | ||
| <10 | 4173 ( 37.3) | 3127 ( 32.9) | 7300 ( 35.3) |
| [10 - 20) | 3113 ( 27.8) | 2655 ( 27.9) | 5768 ( 27.9) |
| >=20 | 3896 ( 34.8) | 3719 ( 39.1) | 7615 ( 36.8) |
| 11182 ( 54.1) | 9501 ( 45.9) | 20683 (100.0) |
| CMH Chi-Square | p.value | df |
|---|---|---|
| 54.0948 | 0 | 2 |

|

|

|
| Duration of Diabetes | Gender | ||
|---|---|---|---|
| Valid Value (%) | NV/NA (%) | ||
| Valid Value | 175349 (100.0) | 0 ( 0.0) | 175349 (100.0) |
| NV/NA | 0 ( 0.0) | 0 ( 0.0) | 0 ( 0.0) |
| 175349 (100.0) | 0 ( 0.0) | 175349 (100.0) |
| CMH Chi-Square |
|---|
| Too many cells have 0 obs |
|
| Duration of Diabetes | Gender | ||
|---|---|---|---|
| Male (%) | Female (%) | ||
| <10 | 52134 ( 62.7) | 57231 ( 62.1) | 109365 ( 62.4) |
| [10 - 20) | 21270 ( 25.6) | 23678 ( 25.7) | 44948 ( 25.6) |
| >=20 | 9726 ( 11.7) | 11310 ( 12.3) | 21036 ( 12.0) |
| 83130 ( 47.4) | 92219 ( 52.6) | 175349 (100.0) |
| CMH Chi-Square | p.value | df |
|---|---|---|
| 14.7484 | 6e-04 | 2 |

|

|

|
| Duration of Diabetes | Gender | ||
|---|---|---|---|
| Valid Value (%) | NV/NA (%) | ||
| Valid Value | 3870 (100.0) | 0 ( 0.0) | 3870 (100.0) |
| NV/NA | 0 ( 0.0) | 0 ( 0.0) | 0 ( 0.0) |
| 3870 (100.0) | 0 ( 0.0) | 3870 (100.0) |
| CMH Chi-Square |
|---|
| Too many cells have 0 obs |

|
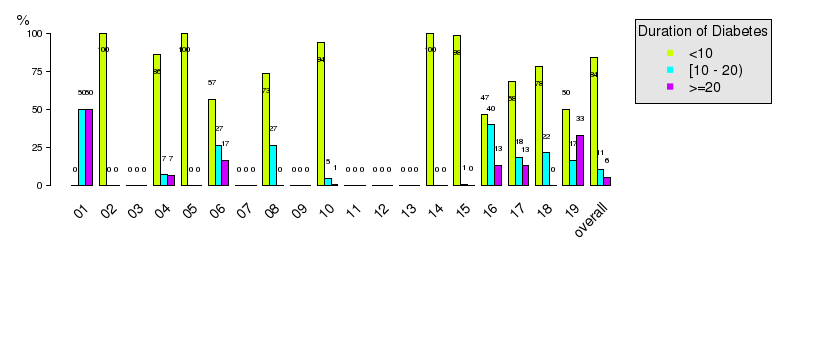
| Duration of Diabetes | Gender | ||
|---|---|---|---|
| Male (%) | Female (%) | ||
| <10 | 1216 ( 73.7) | 1860 ( 83.8) | 3076 ( 79.5) |
| [10 - 20) | 310 ( 18.8) | 236 ( 10.6) | 546 ( 14.1) |
| >=20 | 125 ( 7.6) | 123 ( 5.5) | 248 ( 6.4) |
| 1651 ( 42.7) | 2219 ( 57.3) | 3870 (100.0) |
| CMH Chi-Square | p.value | df |
|---|---|---|
| 62.8639 | 0 | 2 |

|

|
|
| Copyright BIRO Consortium |